

1 INTRODUCTION
The discrete element method (DEM), a powerful numerical simulation tool [1-3], has been widely utilized in the studies of particle materials. In this paper, the Hertz-Mindlin with Johnson-Kendall-Roberts (JKR) contact model [4-6], which is commonly employed in wet particle simulations, is adopted to model wet concrete particles. Nevertheless, the accuracy of the DEM approach is highly reliant on the precise calibration of the contact parameters between particles. To obtain the optimal simulation parameters for wet concrete particles, it is essential to identify which parameters should be optimized and to define the appropriate objective function.
When the optimization parameters and their feasible ranges are undetermined, traditional methods such as analysis of variance (ANOVA) [7] and stepwise regression [8] often suffer from low efficiency, and a high risk of misjudgment or omission when dealing with multi-dimensional parameters and complex models. To avoid these limitations, a combined experimental strategy incorporating the Plackett-Burman (PB) experiment and the steepest ascent experiment [9-12] can be adopted. This approach can rapidly identify the most influential parameters on the experiment and their corresponding value ranges. Furthermore, response surface analysis using the Box-Behnken (BB) test can further determine the optimal parameter combinations [13-15]. The results of these combinations can be utilized as input and training data in the process of solving the objective function.
For determining the objective function, the response surface methodology (RSM) [16-19] is commonly employed due to its ability to approximate complex functional relationships and reduce the likelihood of convergence to local optima. However, RSM often exhibits relatively poor robustness. In contrast, objective function based on the back propagation neural network algorithm (BPNN) [20-23] offers strong nonlinear mapping capability and reduced sensitivity to outliers compared with the RSM. Nevertheless, BPNN training is prone to premature convergence and entrapment in local optima. To compensate these deficiencies, the particle swarm optimization (PSO) algorithm can be utilized to enhance the training efficiency and prediction accuracy of the BPNN [24-26]. This hybrid PSO–BPNN approach enhances training efficiency and prediction accuracy, effectively avoids local optima, and improves overall model robustness, thereby enabling more accurate attainment of the requisite objective function.
After the determination of the objective function, evolutionary algorithms can be adopted to optimize its parameters. Commonly used methods include PSO, ant colony algorithm, bee colony algorithm, differential evolution algorithm, and genetic algorithm (GA). Among them, PSO is characterized by simple parameter adjustments and fast convergence speed [27-29], yet its performance is highly sensitive to the initial parameter settings. In parameter optimization [30-32], the ant colony algorithm is particularly effective for combinatorial and dynamic optimization problems. The bee colony algorithm [33,34] exhibits strong robustness and global search capabilities, making it suitable for complex optimization environments. Differential evolution algorithm [35,36] demonstrates better performance in continuous parameter optimization. GA [37-40], with its mechanisms of population search, such as selection, crossover, and mutation, demonstrates outstanding global performance in avoiding local optima. Its global optimization capability has been validated in high-dimensional nonlinear parameter optimization [41]. For inverse problems characterized by multiple parameters and strong nonlinearity, such as the simulation of wet concrete particles, the global search capability and strong adaptability of GA are particularly suitable. Therefore, GA is ultimately selected in this study for global parameter optimization.
To address existing challenges in the calibration of discrete element method (DEM) parameters for wet particles, such as low efficiency in screening multi-dimensional parameters, limited capability of traditional fitting models, and the tendency of inverse solutions to converge to local optima, this paper integrates experimental design and intelligent algorithms to propose a systematic parameter calibration framework. The study focuses on wet concrete aggregates with a moisture content of 4 % to 6 %. Key influencing parameters are first identified through PB screening and steepest ascent experiments. Subsequently, representative sample data are obtained via BB test, and a PSO-BPNN combined with a GA is constructed to achieve global parameter optimization, enabling systematic calibration of critical parameters, such as particle shape, density, and surface energy. This research provides a high-precision, high-efficiency parameter calibration approach for DEM modeling of wet cohesive granular materials, holding positive significance for enhancing the simulation credibility of related equipment design and process optimization.
2 METHODS
To fulfill the objective of optimizing the simulation parameters of wet concrete particles, four parameters influencing the repose angle were initially selected, namely the coefficient of static friction (X1), the coefficient of rolling friction (X2), the surface energy (X3), and the coefficient of restitution (X4). Based on a review of relevant literature, the value ranges of the four parameters were preliminarily determined. Twelve sets of experiments were designed using the PB experiment to further screen out the most significant influences to the repose angle, namely X1, X2, and X3. Subsequently, five sets of experiments were carried out using the steepest ascent experiment to determine the optimal value intervals of these three parameters. Finally, a total of 17 sets of experiments were conducted using the BB test for RSM analysis, obtaining a second-order regression model describing the relationship between the repose angle and selected parameters. The fitting status of the regression model was verified using the ANOVA method.
To determine the objective function, a PSO-BPNN model was constructed. From the initial 17 sets of experimental sample data, 80 % were randomly selected as training samples, while the remaining 20 % were used as test samples. The training set was employed to train the NN model and optimize its parameters, whereas the test dataset was utilized to assess the generalization ability of the model.
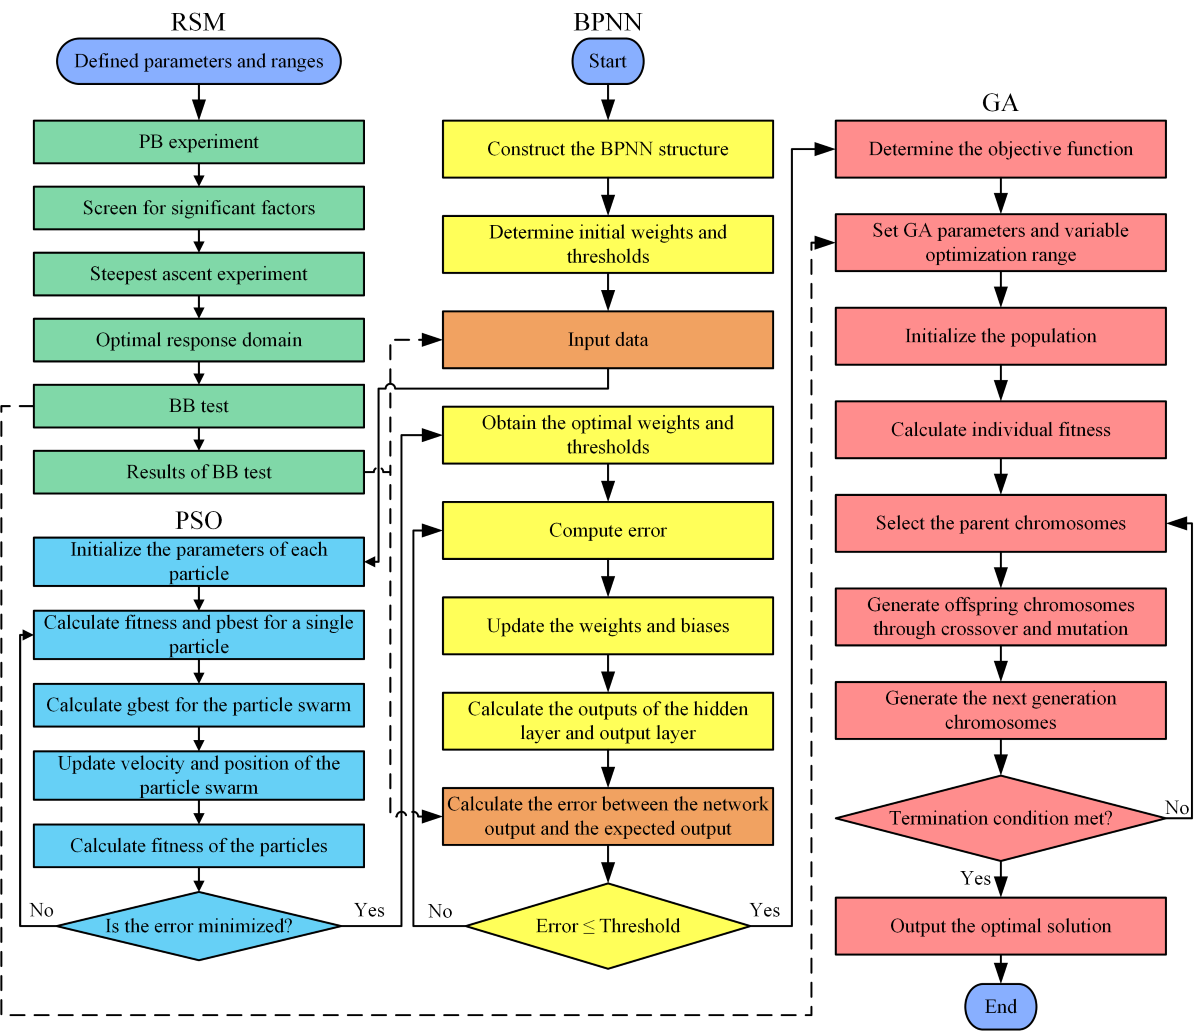
In this paper, the extremum of an unknown nonlinear function cannot be precisely identified solely from its input and output data. Hence, by integrating the nonlinear optimization capability of the GA, with the mean square error (MSE) of the PSO-BP model as the fitness function, and a packing angle of 32.07° as the target value, the coefficient of static friction (X1), the coefficient of rolling friction (X2), and the surface energy (X3) were optimized. The overall optimization procedure is shown in Fig. 1. The number of iterations was set to 50, the population size to 10, and the crossover probability and the mutation probability to 0.4 and 0.2, respectively. The iteration number of 50 and population size of 10 were determined through sensitivity analysis to ensure sufficient convergence while maintaining reasonable computational efficiency. The crossover probability of 0.4 and mutation probability of 0.2 were selected based on commonly adopted GA parameter settings. These values, validated through preliminary experiments, effectively avoid local optima and promote population diversity.
2.1 Experimental Measurement of the Repose Angle
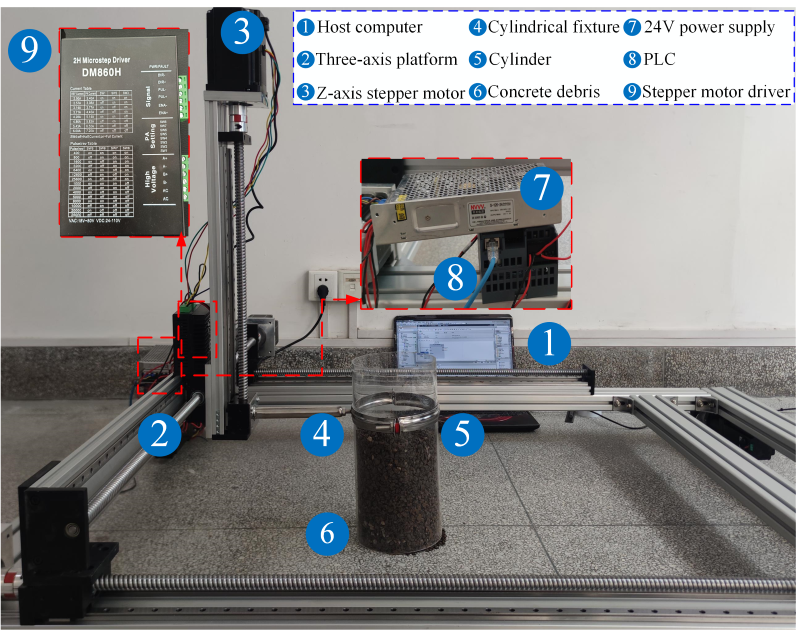
In this paper, the parameters between wet concrete particles were calibrated using a piling (angle of repose) test. The test device is shown in Fig. 2. The test apparatus consisted of a transparent cylindrical container made of organic glass, with diameter of 150 mm, and height of 300 mm. First, the cylinder was placed vertically on a horizontal plane and connected to a three-axis platform using a dedicated fixture to ensure alignment and stability. Then, a certain mass of wet concrete particles was filled into the cylinder. Finally, the Z-axis motor was activated to lift the cylinder at a constant speed of 300 mm/min. As the cylinder was raised, the wet concrete particles discharged freely from the bottom opening and formed a pile on the horizontal plane. When the particles stopped moving, photos of the formed particle pile were taken. The image acquisition system used an NPX-GS6500UM high-speed camera with a maximum resolution of 640×480.
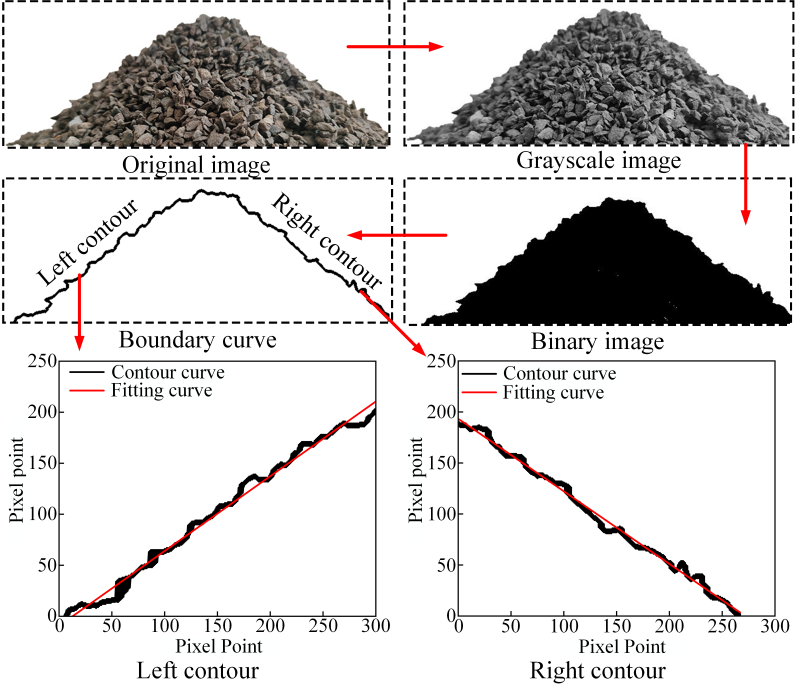
MATLAB software was used to perform grayscale conversion and binarization of the particle pile images, extract the contour of the particle pile profile, and fit them to calculate the magnitude of the tangent value, thereby obtaining the contour inclination (repose) angle of the particle pile. Each group of experiments was repeated five times, obtaining a total of ten datasets. The measured repose angles and corresponding error analysis are summarized in Table 1. The coefficient of variation was calculated to be 3.23 %, which is less than 5 %, proving the measurement method as a reliable one. The final repose angle of the wet concrete particle pile was determined to be 32.07°. The contour extraction process is shown in Fig. 3.
Table 1. Repose angle measurement data and error analysis
| No. | Repose angle [°] | Statistical measure | Value |
|---|---|---|---|
| 1 | 30.61 | Mean | 32.07° |
| 2 | 33.48 | Median | 32.00° |
| 3 | 32.17 | Sample standard deviation | 1.0365° |
| 4 | 31.83 | Range | 2.87° |
| 5 | 33.29 | Coefficient of variation | 3.23 % |
| 6 | 30.92 | Standard error | 0.3277° |
| 7 | 33.04 | 95 % confident interval | (31.33°, 32.81°) |
| 8 | 31.56 | ||
| 9 | 32.74 | ||
| 10 | 31.06 |
2.2 Numerical Simulations of the Repose Angle
2.2.1 Contact Model Considering the Viscosity of Particles
This paper adopts the Hertz-Mindlin with JKR contact model implemented in the commercial software EDEM, also known as the JKR cohesion model, which is mainly applicable to powdery particles such as pharmaceutical powders, ores, soils and other wet materials [42]. This model effectively captures the adhesion and agglomeration effects between particles due to electrostatic force and moisture content. The adhesion force between particles refers to the corresponding surface energy. The concrete particles are simplified and represented as spheres, as shown in Fig. 4.
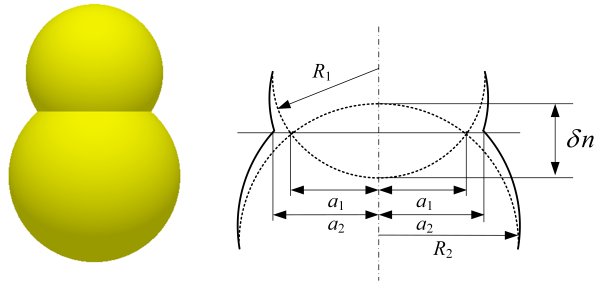
Due to the influence of surface energy, the contact radius between two particles expands from a1 to a2. The work of adhesion W, a key parameter, governing the adhesive force between different concrete particles, can be expressed as:
where, γ1 represents the surface energy of particle 1; γ2 the surface energy of particle 2; γ12 the interfacial surface energy between particle 1 and particle 2. When the particle materials are the same, the interfacial energy γ12 = 0, that is, γ1 = γ2 = γ, thus the effect of adhesion between the same particles becomes W = 2 γ.
The normal elastic contact force FJKR of wet particles and the normal overlap are presented in Eqs. (2) and (3).
where, γ represents the surface energy of the particles, E* the equivalent elastic modulus, a2 the radius of the contact surface after the collision of two particles, and R* the equivalent contact radius. Among them:
where, E1, v1, and R1 represent the elastic modulus, Poisson’s ratio, and radius of particle 1, respectively; E2, v2, and R2 represent the elastic modulus, Poisson’s ratio, and radius of particle 2, respectively.
When the surface energy of the particles equals 0 J/m2, the normal elastic contact force FJKR of this model can be simplified to the contact force FHertz of the Hertz contact model, as expressed in Eq. (6):
2.2.2 Particle Packing Simulation Test
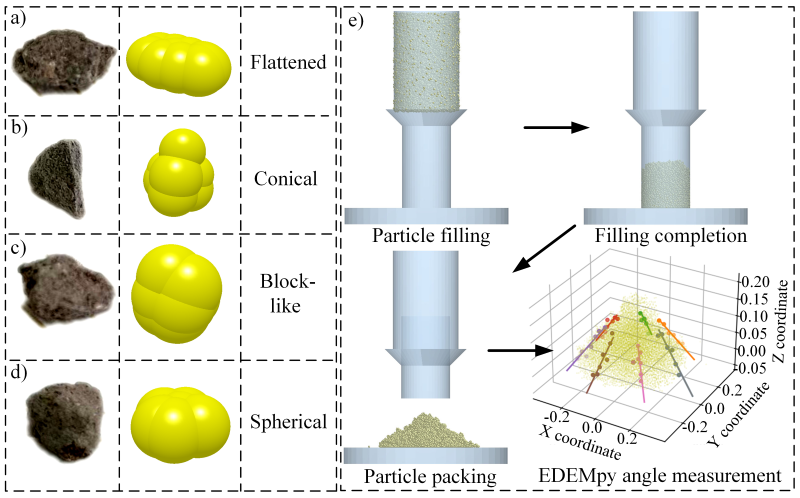
When conducting simulations in EDEM, it is essential to model particle behavior based on the actual morphology of concrete particles. However, the complex geometry of concrete fragments would significantly increase computational costs. Therefore, the particle shapes need to be appropriately simplified. Based on existing studies on particle shape characterization [43], this work focuses on four typical and geometrically representative shapes as research objects: flattened, conical, block-like and spherical. These shapes essentially capture the principal contours and contact characteristics of real fragments, thereby meeting the requirements for simulating accumulation behavior. Using the multi-sphere assembly approach based on spherical primitive elements, the non-spherical particles were constructed, as shown in Fig. 5. The particle diameters were maintained within the range of 3 mm to 5 mm.
The repose angle test was conducted in the numerical simulation using the established concrete fragment particle models . The cylinder sizes in the simulation test were consistent with those used in the physical experiments. The simulation procedure was as follows: First, a finite set of particles was defined, and a certain mass of concrete particles was generated in the container. After particle generation was completed and the particles reached a stable state, the cylinder was lifted upward at a constant speed of 300 mm/min. As the cylinder rose, the concrete particles began to fall and accumulate on the bottom plane, ultimately forming an approximately conical particle pile. Through EDEM post-processing, the simulation was terminated when the velocities of all particles were 0 m/s. The simulation time was set to 3 s, with a time step of 1×10⁻³ s. The simulation hardware included a central processing unit (CPU) model Intel(R) Xeon(R) W-2245 CPU @ 3.90 GHz, 3.91 GHz, and 32 GB of random-access memory (RAM).
After completing the accumulation simulation in EDEM, to repose angle was accurately determined using EDEMpy interface. The three-dimensional coordinates of all stationary particles were directly extracted, and the three-dimensional surface topography of the particle pile was reconstructed. Contour lines were then derived from the fitted surface, to calculate its inclination angle as the simulated repose angle. This method calculates the repose angle directly from the particle spatial data, thereby avoiding potential errors introduced by secondary image processing. Each group of simulation tests was repeated three times. The accumulation process obtained from the simulation is shown in Fig. 5e.
3 RESULTS AND DISCUSSION
3.1 Screening of Significant Parameters Through the PB Experiment
In this study, based on existing literature [44-47] on similar materials, the value ranges for four key parameters, namely the coefficient of restitution, coefficient of static friction, coefficient of rolling friction, and surface energy, were preliminarily determined. The Design-Expert 13 software was used to design the PB experiment to evaluate the effects of these influencing factors and screen out the factors significantly affecting the repose angle. Each factor was set at two levels, high and low, resulting in a total of 12 experimental runs. The final ranges for the four parameters are shown in Table 2.
Table 2. Parameters of PB experiment
| Symbol | Parameter | Low level (–1) | High level (+1) |
|---|---|---|---|
| X1 | Coefficient of static friction | 0.05 | 0.5 |
| X2 | Coefficient of rolling friction | 0.03 | 0.4 |
| X3 | Surface energy [J/m2] | 0.5 | 2 |
| X4 | Coefficient of restitution | 0.1 | 0.4 |
Table 3. PB experimental design and results
| No. | X1 | X2 | X3 [J/m2] | X4 | Repose angle Y [°] |
|---|---|---|---|---|---|
| 1 | 0.5 | 0.03 | 0.5 | 0.4 | 22.03 |
| 2 | 0.5 | 0.03 | 2 | 0.4 | 24.78 |
| 3 | 0.5 | 0.03 | 2 | 0.1 | 25.12 |
| 4 | 0.05 | 0.03 | 2 | 0.1 | 27.76 |
| 5 | 0.05 | 0.4 | 2 | 0.4 | 36.93 |
| 6 | 0.5 | 0.4 | 2 | 0.1 | 33.29 |
| 7 | 0.05 | 0.03 | 0.5 | 0.4 | 22.36 |
| 8 | 0.05 | 0.4 | 2 | 0.4 | 37.15 |
| 9 | 0.05 | 0.4 | 0.5 | 0.1 | 30.78 |
| 10 | 0.5 | 0.4 | 0.5 | 0.4 | 27.84 |
| 11 | 0.5 | 0.4 | 0.5 | 0.1 | 32.25 |
| 12 | 0.05 | 0.03 | 0.5 | 0.1 | 23.79 |
The PB experimental design and corresponding results are shown in Table 3, while ANOVA for the effect of the four parameters on the repose angle is shown in Table 4.
Table 4. ANOVA of the PB experiment
| Indicator | Source of variance | Sum of squares | Degrees of freedom | Mean square | F | P value |
|---|---|---|---|---|---|---|
| Repose angle | Model | 300.46 | 4 | 75.11 | 34.45 | 0.0001** |
| Coefficient of static friction | 15.10 | 1 | 15.10 | 6.92 | 0.0338* | |
| Coefficient of rolling friction | 228.81 | 1 | 228.81 | 104.93 | <0.0001** | |
| Surface energy [J/m2] | 56.25 | 1 | 56.25 | 25.79 | 0.0014** | |
| Coefficient of restitution | 0.3008 | 1 | 0.3008 | 0.1380 | 0.7213 | |
| Residual | 15.26 | 7 | 2.18 | |||
| Comprehensive | 315.72 | 11 |
Note: ** indicates extremely significant (P < 0.01), * indicates significant (0.01 ≤ P < 0.05).
The results demonstrate that the P-values of the coefficient of static friction, the coefficient of rolling friction, and the surface energy between wet concrete particles are all less than 0.05 J/m2, demonstrating that these parameters have a significant influence on the repose angle. In contrast, the P-value of the coefficient of restitution is 0.7213, which exceeds 0.05, indicating no significant effect. This behavior can be attributed to the dominance of adhesive forces in the wet concrete particle system. Under low-speed accumulation conditions, the slight rebound tendency following particle collisions is rapidly suppressed and dissipated by the strong surface energy in the JKR model. Consequently, its elastic recovery effect has a negligible impact on the final accumulation morphology. Furthermore, the coefficient of variation of the experimental data is 5.15 %, which is below 10 %, indicating good experimental stability. The adjusted coefficient of determination (R2adj) is 0.9240, signifying a high level of agreement between the regression model and the experimental data. In addition, the adequate precision value is 16.0584, which is significantly higher than the recommended minimum value of 4, further confirming the high reliability of the experiment.
3.2 Optimal Value Range of Significant Parameters Determined by Steepest Ascent Experiment
Based on the results of the PB experiment, the non-significant factor was set at its mid-level in subsequent experiments. Specifically, the coefficient of restitution was set to 0.2. For the three significant parameters identified through the PB experiment, appropriate gradient values were determined based on their relative influence strength. This allowed the experimental points to move along the steepest ascent direction on the predicted response surface, thereby efficiently approaching the optimal region. Accordingly, five groups of steepest ascent experiments were conducted. The corresponding experimental design and results are presented in Table 5.
Table 5. Design and results of the steepest ascent experiment
| No. | X1 | X2 | X3 [J/m2] | Repose angle (Y) [°] | Relative error |
|---|---|---|---|---|---|
| 1 | 0.05 | 0.03 | 0.5 | 18.08 | 44.95 % |
| 2 | 0.112 | 0.122 | 0.875 | 23.67 | 27.92 % |
| 3 | 0.275 | 0.215 | 1.25 | 34.24 | 4.26 % |
| 4 | 0.438 | 0.308 | 1.625 | 42.51 | 29.45 % |
| 5 | 0.5 | 0.4 | 2 | 46.85 | 42.66 % |
The results show that the repose angle of the wet concrete particles increases with increasing values of X1, X2 and X3. Meanwhile, the relative error between the simulated and experimentally measured angles of repose initially decreases and then increases. It can be obtained from Table 5, that test 3 exhibits the minimum relative error of 4.26 %, indicating that the optimal response region is located near Level 3. Accordingly, the parameter ranges defined by the two adjacent experimental groups were taken as the value range for the BB test for conducting the RSM analysis test. Based on this, RSM regression model was established.
3.3 Response Surface Methodology (RSM)
Based on the results of the steepest ascent experiment, the BB test was employed for RSM to determine the optimal parameter combination. The parameter ranges of the steepest ascent experiment results were adopted as the upper and lower limits for the response surface analysis, while the non-significant parameters were fixed at the intermediate level. The coded factor levels used in the BB experimental design are shown in Table 6.
Table 6. Coded factor levels used in the BB experimental design
| Level | X1 | X2 | X3 [J/m2] |
|---|---|---|---|
| Low level | 0.112 | 0.122 | 0.875 |
| Middle level | 0.275 | 0.215 | 1.25 |
| High level | 0.438 | 0.308 | 1.625 |
According to Table 6, a BB response surface experiment with 17 runs was designed for three factors at three levels. This experimental design was employed to explore the influence of variables on the repose angle, and to calibrate and optimize the sensitive coefficients (coefficient of static friction, coefficient of rolling friction, and surface energy). The detailed BB experimental design and results are shown in Table 7.
Table 7. Design and results of BB test
| No. | X1 | X2 | X3 [J/m2] | Repose angle (Y) [°] |
|---|---|---|---|---|
| 1 | 0.438 | 0.215 | 1.625 | 37.85 |
| 2 | 0.112 | 0.122 | 1.25 | 25.59 |
| 3 | 0.275 | 0.122 | 1.625 | 30.36 |
| 4 | 0.275 | 0.215 | 1.25 | 34.93 |
| 5 | 0.275 | 0.122 | 0.875 | 24.13 |
| 6 | 0.112 | 0.215 | 1.625 | 33.15 |
| 7 | 0.112 | 0.215 | 0.875 | 32.09 |
| 8 | 0.275 | 0.308 | 0.875 | 38.27 |
| 9 | 0.438 | 0.308 | 1.25 | 41.53 |
| 10 | 0.438 | 0.122 | 1.25 | 31.43 |
| 11 | 0.112 | 0.308 | 1.25 | 41.15 |
| 12 | 0.275 | 0.215 | 1.25 | 34.24 |
| 13 | 0.275 | 0.215 | 1.25 | 34.37 |
| 14 | 0.275 | 0.215 | 1.25 | 33.53 |
| 15 | 0.438 | 0.215 | 0.875 | 36.37 |
| 16 | 0.275 | 0.308 | 1.625 | 38.44 |
| 17 | 0.275 | 0.215 | 1.25 | 32.47 |
The experimental results were analyzed using RSM. By taking the coefficient of static friction (X1), the coefficient of rolling friction (X2), and the surface energy (X3) as independent variables, and the repose angle (Y) as the response value, the second-order multiple regression equation was obtained:
Y = 33.91 + 1.9{X_1} + 5.99{X_2} + 1.12{X_3} – 1.37{X_1}{X_2} + 0.105{X_1}{X_3} \\
– 1.52{X_2}{X_3} + 1.54X_1^2 – 0.524X_2^2 – 0.584X_3^2. \\
\end{gathered}\quad \quad (7)$$
The ANOVA was employed to validate the adequacy of the regression equation and to examine the statistical significance of the model, including the main effects and interaction effects of each factor. The results are presented in Table 8. The regression model exhibits P < 0.0001, indicating that the correlation between the independent variables and the response values of the model is highly significant. The P-value of the lack-of-fit term is 0.3225 (P > 0.05), suggesting the lack of fit is not significant relative to the pure error and that the regression model adequately represents the experimental data. The coefficient of determination (R2 = 0.9783) and the adjusted R2 (R2adj = 0.9503) are both close to 1, indicating excellent agreement between the computational model and experimental data. Furthermore, the difference between the R2adj and the predicted coefficient of determination (R2pre = 0.7948) is less than 0.2, further supporting model reliability. Moreover, the adequate precision (21.2234 > 4) confirms the high dependability of the regression equation. Additionally, the effects of the coefficient of static friction and the coefficient of rolling friction between the wet concrete particles exhibit extremely significant effects (P < 0.01) on the repose angle.
3.4 Influence of Interaction Factors on the Repose Angle
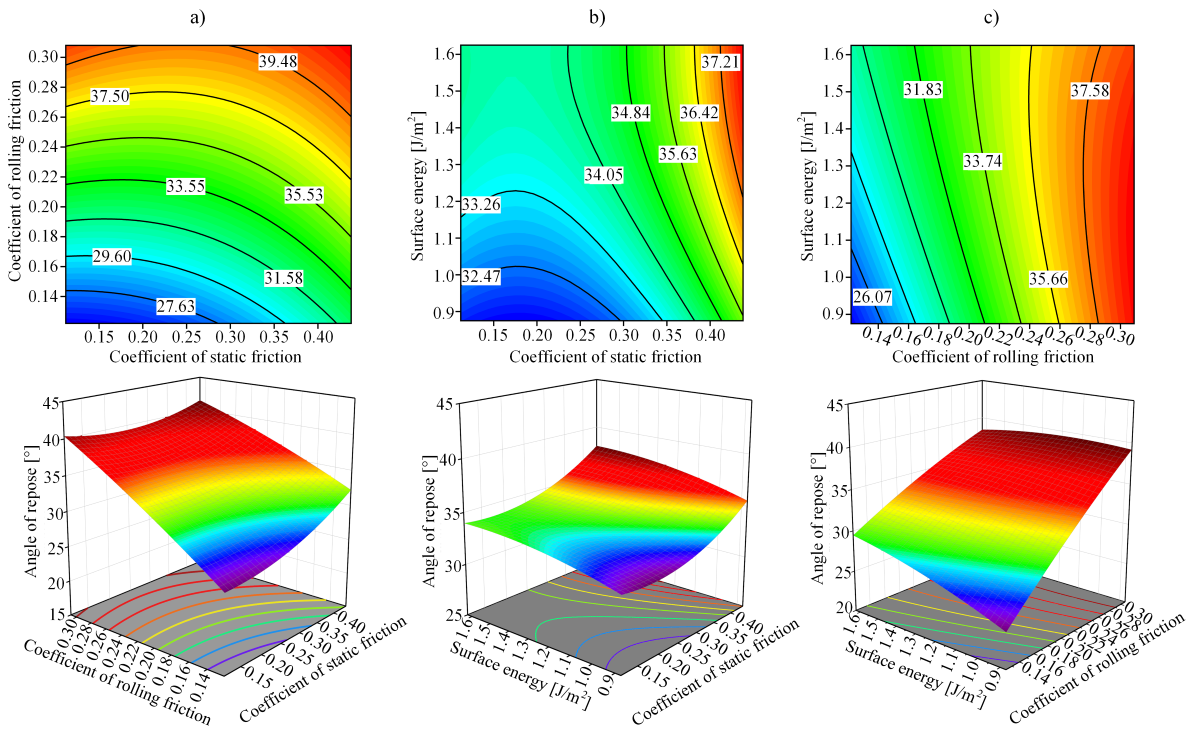
When the remaining factors were fixed at their median values, contour plots of each interaction term and the response surface of the interaction relative to the repose angle were depicted using Design-Expert 13. These plots enable a visual assessment of the interaction effects between pairs of factors. As shown in Fig. 6, the curve graphs indicate the existence of a nonlinear relationship between influencing factors and the repose angle. Fig. 6a presents the response surface describing the interaction between the coefficient of static friction (X1) and the coefficient of rolling friction (X2) . Compared with X1 direction, the response surface exhibits a steeper gradient along the X2 direction, suggesting that the influence of X1 on the repose angle is relatively smaller than that of X2. Fig. 6b is the response graph of the interaction between the coefficient of static friction (X1) and the surface energy (X3). Through the contour plot, it can be observed that there is no significant interaction between X1 and X3. In this case X1 has a greater influence on the repose angle than X3. Fig. 6c shows the interaction between the coefficient of rolling friction (X2) and the surface energy (X3). The response surface curve reveals a steeper slope along X2 axis than along X3 axis, indicating that the contribution of X2 to the repose angle is more significant than that of X3. By comparing Figs. 6a and c, it can be stated that the relative influence of the three factors on the repose angle follows the order: X2 > X1 > X3, which is consistent with the result of the ANOVA.
Table 8. The ANOVA results of the BB test
| Source | Sum of squares | Degree of freedom | Mean square | F | P value | Significance |
|---|---|---|---|---|---|---|
| Model | 354.12 | 9 | 39.35 | 34.98 | <0.0001 | Significant |
| X1 Coefficient of static friction | 28.88 | 1 | 28.88 | 25.68 | 0.0015** | |
| X2 Coefficient of rolling friction | 286.56 | 1 | 286.56 | 254.80 | <0.0001** | |
| X3 Surface energy [J/m2] | 9.99 | 1 | 9.99 | 8.88 | 0.0205* | |
| X1X2 | 7.45 | 1 | 7.45 | 6.63 | 0.0368* | |
| X1X3 | 0.0441 | 1 | 0.0441 | 0.0392 | 0.8487 | |
| X2X3 | 9.18 | 1 | 9.18 | 8.16 | 0.0244* | |
| X12 | 10.00 | 1 | 10.00 | 8.89 | 0.0205* | |
| X22 | 1.16 | 1 | 1.16 | 1.03 | 0.3444 | |
| X32 | 1.44 | 1 | 1.44 | 1.28 | 0.2957 | |
| Residual | 7.87 | 7 | 1.12 | |||
| Lack of fit | 4.29 | 3 | 1.43 | 1.60 | 0.3225 | Insignificant |
| Pure error | 3.58 | 4 | 0.8947 | |||
| Cor total | 361.99 | 16 | ||||
| R2 | 0.9783 | |||||
| R2adj | 0.9503 | |||||
| R2pre | 0.7948 | |||||
| Adequate precision | 21.2234 |
Note: ** indicates extremely significant (P < 0.01), and * indicates significant (0.01 ≤ P < 0.05)
3.5 Optimal Model
3.5.1 Establishment of the PSO-BP Model
To improve the prediction performance of the BPNN and avoid its tendency to fall into local optima, we used the PSO algorithm to globally optimize its initial weights and thresholds [48]. This optimization process maps the parameters to be optimized in the BP network to the position of each particle within the swarm. By iteratively evaluating the network prediction error corresponding to parameter combinations and tracking both individual and group historical optimal solutions, the qwarm search is dynamically guided toward optimal regions of the solution space.
To construct the PSO-BPNN model, 80 % of the sample data was used as the training, and the remaining 20 % was reserved for testing. The parameters for the PSO algorithm were set as follows: the population size was set to 10 to balance computational efficiency and global search capability; the maximum number of iterations was set to 30, determined through convergence testing to ensure algorithm stability within a reasonable timeframe; the particle position range was set between [–2, 2], and the particle velocity range was set to [-0.5, 0.5] to avoid premature convergence; the inertia weight was set to 0.6, and the acceleration constants c1 and c2 were both set to 2 to promote a balance between exploration and exploitation; the maximum number of training epochs was set to 100, the learning rate was set to 0.01, and the minimum training error target was set to 10–5. These parameters were selected according to the training requirements of the BPNN and further optimized through trial and error to minimize prediction error.
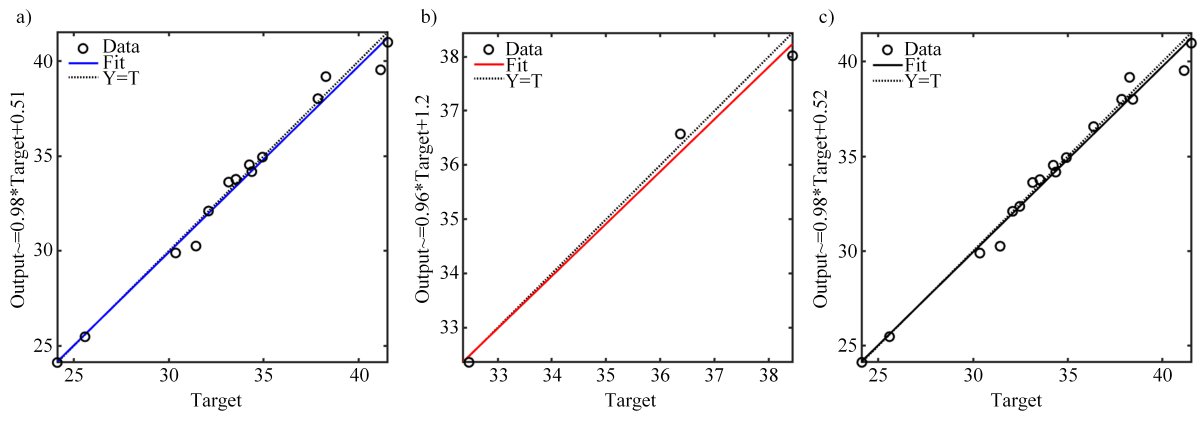
Figure 7 presents the relationship between the network output values and the objective functions of the training, test, and complete sets. The results indicate that the correlation coefficients R of all datasets exceed 0.95, with no overfitting phenomenon occurring, suggesting that the model’s good generalization performance.
3.5.2 Comparison of Models
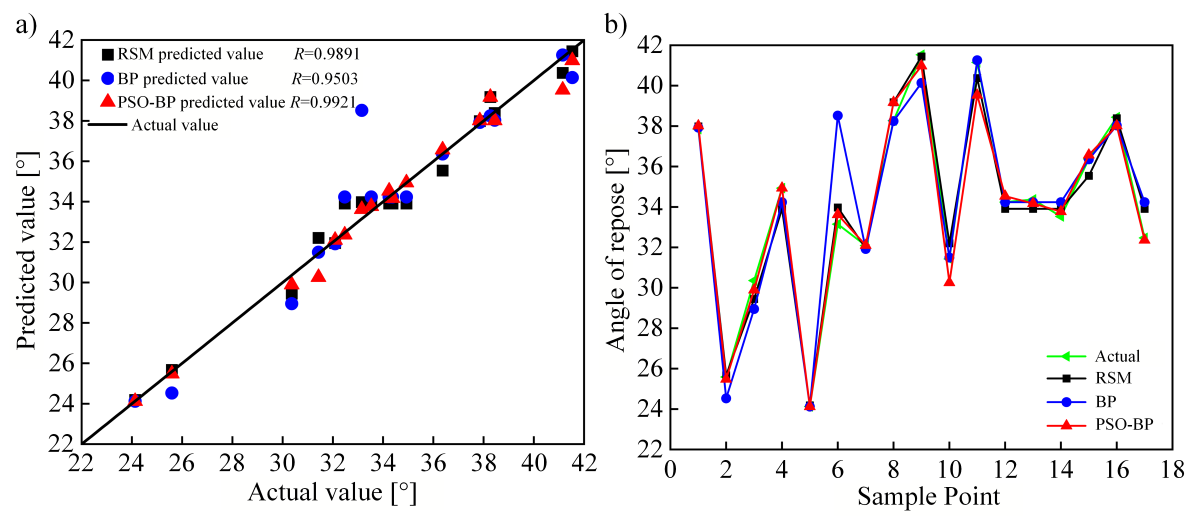
This study compares the prediction performance of RSM, BP and PSO-BP. The comparison graph between the predicted and actual values for each model is shown in Fig. 8a. The correlation coefficient R was calculated to evaluate the predictive accuracy of each model. The results show that the PSO-BP achieves the highest correlation cofficient, which is 0.9921, suggesting that the PSO-BPNN model outperforms the RSM and BPNN models in terms of prediction accuracy, stability and generalization capability. Fig. 8b represents the comparison curves of the fitting results obtained from the three models.
To assess the predictive performance of the different models, the coefficient of determination (R2), mean square error (MSE), and average absolute deviation (AAD) were adopted as evaluation metrics. A higher R2 value closer to 1, together with the lower the MSE and AAD values, indicates better predictive accuracy of the model. The calculations of each evaluation index are provided in Eqs. (8) to (10).
where n is the number of samples, \( \widehat {{Y_i}} \) and Yi are predicted and actual value of ith sample, respectively; and \( \overline Y \) is the mean of the actual values. The comparative results of prediction accuracy among different models are presented in Table 9.
Table 9. Comparison of prediction accuracy among different models
| Prediction model | R2 | MSE | AAD |
|---|---|---|---|
| RSM | 0.9503 | 0.4631 | 0.5419 |
| BP | 0.9031 | 2.2467 | 0.7886 |
| PSO-BP | 0.9830 | 0.3530 | 0.4087 |
As indicated in Table 9, the R2 value of the PSO-BP model is closer to 1 compared to the other two models, while its MSE and AAD values are significantly lower. This demonstrates that PSO-BP effectively decreases prediction error and achieves a better fit between the predicted and actual values. This advantage stems from the global search capability of PSO algorithm. The algorithm uses prediction error as the fitness function, performs parallel optimization in the solution space, and provides the BP network with a set of initial weights and thresholds that are close to the global optimum. This effectively overcomes the inherent limitation of standard BP, where gradient descent is prone to falling into local optima, enabling more stable and accurate convergence performance in strongly nonlinear parameter inversion for wet concrete.
3.5.3 Parameter Optimization Using PSO-BP-GA
Based on the established PSO-BPNN prediction model, the ranges of each input parameter and the optimization target were determined. GA was then employed to optimize the model parameters. To obtain the optimal combination of parameters, with 32.07° as the optimization objective, the objective function and constraint function of the established optimization problem are defined as follows:
{Y = ({X_1},{X_2},{X_3}) = 32.07} \\
{s.t.\left\{ {\begin{array}{*{20}{c}}
{0.112 \leqslant {X_1} \leqslant 0.438} \\
{0.122 \leqslant {X_2} \leqslant 0.308} \\
{0.875 \leqslant {X_3} \leqslant 1.625}
\end{array}} \right.}
\end{array}} \right..\quad \quad (11)$$
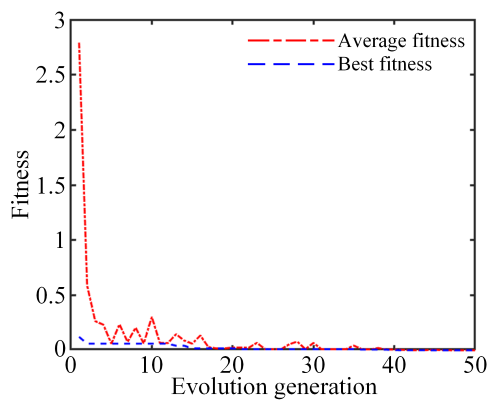
Figure 9 illustrates the evolution of fitness value with respect to the evolutionary generations. The fitness is defined as the root mean square error (RMSE) between the predicted value and the target value. In the initial stage, the GA rapidly reduces the fitness via population-based search. Subsequently, as crossover and selection operations are performed, the fitness fluctuates within a narrow range and gradually approaches the target value. By the 17th generation, the fitness curve tends to converge, suggesting a substantial reduction in the disparity between the predicted and target values. When the number of iterations reaches 50, the GA terminates and outputs the optimal individual, obtaining the optimal parameters: the coefficient of static friction of 0.158, the coefficient of rolling friction of 0.187, and the surface energy of 1.580 J/m2.
3.6 Validations
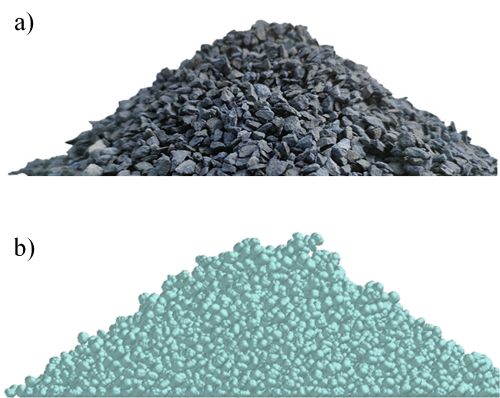
The optimized parameter values obtained were imported into EDEM to conduct the simulation test of the repose angle. Five independent simulations were carried out to simulate the accumulation behavior of concrete particles. The repose angles obtained by EDEMpy were 31.73°, 32.64°, 32.96°, 32.17°, and 32.05°, respectively. The average repose angle was 32.31°, showing a relative error of only 0.748 % compared with the experimental mean value. As shown in Fig. 10, a comparison between the simulation results and the experimental observations show no significant discrepancy between the repose angle or the particle accumulation morphology. These results verify the accuracy of the optimized parameters.
4 CONCLUSIONS
1. The PB experiment and steepest ascent experiment were employed to screen out the significant factors (coefficient of static friction, coefficient of rolling friction and surface energy among wet concrete particles) that affect repose angle, and to further narrow the range of significant parameter values.
2. By comparing the performance metrics (R2, MSE, and AAD) of the RSM, BP, and PSO-BP models, the PSO-BP model was found to exhibit superior predictive performance, achieving the highest R2 value (0.9830), and the lowest MSE (0.3530) and AAD (0.4087). This indicates that BP optimized by PSO can effectively reduce the prediction error and demonstrates higher predictive ability and fitting stability.
3. The GA was employed to conduct the inverse function optimization based on the established PSO-BP model, resulting optimal contact parameters for wet concrete particles: a static friction coefficient of 0.158, a rolling friction coefficient of 0.187, and a surface energy of 1.580. The average repose angle value of the five measured simulation was 32.31°, with a relative error of only 0.748 %. Therefore, the PSO-BP-GA method is effective for high-precision calibration of wet concrete contact parameters.
In summary, this study proposes a hybrid calibration framework that integrates experimental design, response surface analysis, and intelligent algorithm optimization. This method efficiently identifies key parameters through experimental design, utilizes the PSO-BP model to establish a complex nonlinear mapping relationship between contact parameters and the repose angle, and employs GA to achieve global inversion optimization. Validation results indicate that this method can efficiently and accurately determine discrete element contact parameters for wet concrete, providing a reliable solution for calibrating discrete element parameters of wet cohesive particle systems and significantly enhancing the accuracy and reliability of DEM parameter calibration.
References
[1] Yan, D.X., Yu, J.Q., Liang, L.S., Wang, Y., Yu, Y.J., Zhou, L., et al. A comparative study on the modelling of soybean particles based on the discrete element method. Processes 9 286 (2021) DOI:10.3390/pr9020286.
[2] Yan, D.X., Yu, J.Q., Wang, Y., Sun, K., Zhou, L., Tian, Y., et al. Measurement and calibration of DEM parameters of soybean seed particles. Agric (Basel) 12 1825 (2022) DOI:10.3390/agriculture12111825.
[3] Xu, T.Y., Fu, H., Liu, M., Feng, W.Z., Zhang, R.X., Wang, Y., Ellipsoidal seed modeling and simulation parameter selection based on the discrete element method. Mater Today Commun 37 106923 (2023) DOI:10.1016/j.mtcomm.2023.106923.
[4] Ajmal, M., Roessler, T., Richter, C., Katterfeld, A. Calibration of cohesive DEM parameters under rapid flow conditions and low consolidation stresses. Powder Technol 374 22-32 (2020) DOI:10.1016/j.powtec.2020.07.017.
[5] Washino, K., Chan, E.L., Faroux, D., Tsuji, T., Takahashi, T., Sasabe, S. On DEM simulation of loose packing behaviour of fine and cohesive particles. Adv Powder Technol 36 104809 (2025) DOI:10.1016/j.apt.2025.104809.
[6] Coetzee, C.J., Scheffler, O.C. Review: The calibration of dem parameters for the bulk modelling of cohesive materials. Processes 11 5 (2023) DOI:10.3390/pr11010005.
[7] Choi, Y., Park, S., Park, C., Kim, D., Kim, Y. Meta-anova: Screening interactions for interpretable machine learning. J Korean Stat Soc 54 478-495 (2025) DOI:10.1007/s42952-024-00302-2.
[8] Mohsenijam, A., Siu, M.F.F., Lu, M. Modified stepwise regression approach to streamlining predictive analytics for construction engineering applications. J Comput Civ Eng 31 (2017) DOI:10.1061/(asce)cp.1943-5487.0000636.
[9] Yu, Z.Y., Xiong, W., Zhu, D.Q., Xue, K., Zhang, S., Kuang, F.M., et al. Analysis and calibration of parameters of wet-viscous paddy mud particles based on the slump experiment. Inmateh-Agric Eng 68 177-190 (2022) DOI:10.35633/inmateh-68-18.
[10] Zhang, J.X., Wang, Q.Y., Niu, F.S., Yu, X.D., Chang, Z.J., Wu, F., et al. Simulation and verification of discrete element parameter calibration of pulverized coal particles. Int J Coal Prep Util 45 1244-1263 (2025) DOI:10.1080/19392699.2024.2379405.
[11] Fang, W.Q., Wang, X.Z., Han, D.L., Chen, X.G. Review of material parameter calibration method. Agric (Basel) 12 706 (2022) DOI:10.3390/agriculture12050706.
[12] Shi, Z.L., Wang, M.J., Zhang, X.J., Cheng, J.P., Lu, D.M. Calibration and optimization of discrete element parameters for coated cotton seeds. Eng Agric 44 (2024) DOI:10.1590/1809-4430-Eng.Agric.v44e20230085/2024.
[13] Yang, L.Y., Chen, W.H., Kan, Z., Meng, H.W., Qi, J.T. Parameter calibration for discrete element simulation of leymus chinensis seeds based on RSM optimization. Sci Rep 15 7947 (2025) DOI:10.1038/s41598-025-89181-z.
[14] Yang, L., Li, J.W., Lai, Q.H., Zhao, L.L., Li, J.J., Zeng, R.H., Discrete element contact model and parameter calibration for clayey soil particles in the southwest hill and mountain region. J Terramech 111 73-87 (2024) DOI:10.1016/j.jterra.2023.10.002.
[15] Athijayamani, A., Ganesamoorthy, R., Loganathan, K.T., Sidhardhan, S. Modelling and analysis of the mechanical properties of agave sisalana variegata fibre/vinyl ester composites using Box-Behnken design of response surface methodology. Stroj Vestn-J Mech E 62 273-280 (2016) DOI:10.5545/sv-jme.2015.2641.
[16] Ren, J.Q., Xiao, M., Liu, G.Q. Rock macro-meso parameter calibration and optimization based on improved BP algorithm and response surface method in PFC 3D. Energies 15 6290 (2022) DOI:10.3390/en15176290.
[17] Tang, X.X., Yue, Y.H., Shen, Y.S. Prediction of separation efficiency in gas cyclones based on RSM and GA-BP: Effect of geometry designs. Powder Technol 416 118185 (2023) DOI:10.1016/j.powtec.2022.118185.
[18] Wang, C.Y., Wang, G.C., Shen, C.E. Analysis and prediction of grind-hardening surface roughness based on response surface methodology-BP neural network. Appl Sci (Basel) 12 12680 (2022) DOI:10.3390/app122412680.
[19] Chehreghani, S., Noaparast, M., Rezai, B., Shafaei, S.Z. Bonded-particle model calibration using response surface methodology. Particuology 32 141-152 (2017) DOI:10.1016/j.partic.2016.07.012.
[20] Li, X.Y. Application of particle swarm optimization algorithm in computer neural network. Int Conf Comp Syst Electr Contr 446-449 (2017).
[21] Cao, G.D., Su, H.W., Xie, S., Li, Z.G., Deng, D.Q., Jiang, S.Q., et al. Numerical investigation on pumping behavior of fresh concrete by CFD-DEM, considering uneven distribution of aggregate. Constr Build Mater 465 140130 (2025) DOI:10.1016/j.conbuildmat.2025.140130.
[22] Qi, J.T., Zhao, W.W., Kan, Z., Meng, H.W., Li, Y.P. Parameter optimization of double-blade normal milk processing and mixing performance based on RSM and BP-GA. Food Sci Nutr 7 3501-3512 (2019) DOI:10.1002/fsn3.1198.
[23] Jin, Z.J., Cheng, G., Xu, S.C., Yuan, D.P. Error prediction for a large optical mirror processing robot based on deep learning. Stroj Vestn-J Mech E 68 175-184 (2022) DOI:10.5545/sv-jme.2021.7455.
[24] Li, H.X., Li, G., Huang, Z.Y., Chen, M., Application of BP neural network based on genetic algorithm optimization. Int Conf Intell Info Process (2019) 160-165.
[25] Xia, Q.J., Ji, Y.C. Study on frost resistance of recycled rubber straw concrete using particle swarm optimization enhanced artificial neural networks. Polymers 16 3191 (2024) DOI:10.3390/polym16223191.
[26] Pan, X.P., Niu, Y.W., Zhao, Y., Huang, P.M., Wu, Y.Z. Parameter calibration method of clustered-particle logic concrete dem model using BP neural network-particle swarm optimisation algorithm (BP-PSO) inversion method. Eng Fract Mech 292 (2023) DOI:10.1016/j.engfracmech.2023.109659.
[27] Zhang, X.Y., Li, Y., Chu, G.S. Comparison of parallel genetic algorithm and particle swarm optimization for parameter calibration in hydrological simulation. Data Intell 904-922 (2023) DOI:10.1162/dint_a_00221.
[28] Rojas-Delgado, J., Núñez, V.M., Trujillo-Rasúa, R., Bello, R. Continuous hyper-parameter configuration for particle swarm optimization via auto-tuning. Iberoam Congr Pattern Recognit 458-468 (2019).
[29] Isiet, M., Gadala, M. Self-adapting control parameters in particle swarm optimization. Appl Soft Comput 83 105653 (2019) DOI:10.1016/j.asoc.2019.105653.
[30] Chen, Y.B., Guo, Z., Liu, J.G. An improved ant colony algorithm for PID parameters optimization. Int Conf Intell Comput Technol Autom 157-160 (2009) DOI:10.1007/978-3-030-33904-3_43.
[31] Fidanova, S., Roeva, O. Influence of ant colony optimization parameters on the algorithm performance. Int Conf Large-Scale Sci Comput 358-365 (2017).
[32] Abdelbar, A.M., Salama, K.M. Parameter self-adaptation in an ant colony algorithm for continuous optimization. IEEE Access 7 18464-18479 (2019) DOI:10.1109/access.2019.2896104.
[33] Zhi, D. Optimization of PID controller for single phase inverter based on ABC. Int Conf Control Autom Robot 501-504 (2019) DOI:10.1007/978-3-319-73441-5_38.
[34] Abhijith, Srinivasa, P., Grynal, D., Gautama, H. Surface roughness optimization in machining of az31 magnesium alloy using ABC algorithm. Int Conf Res Mech Eng Sci 144 03306 (2017) DOI:10.1051/matecconf/201814403006.
[35] Bäck, T.H.W., Kononova, A.V., van Stein, B., Wang, H., Antonov, K.A., Kalkreuth, R.T. et al. Evolutionary algorithms for parameter optimization-thirty years later. Evol Comput 31 81-122 (2023) DOI:10.1162/evco_a_00325.
[36] Pan, J.S., Yang, C., Meng, F.J., Chen, Y.X., Meng, Z.Y. A parameter adaptive DE algorithm on real-parameter optimization. J Intell Fuzzy Syst 38 5775-5786 (2020) DOI:10.3233/jifs-179665.
[37] Liu, Z.M., Li, C.Q., Feng, K., Application research of bp neural network optimized by genetic algorithm and particle swarm optimization algorithm in mbr simulation. Int Conf Artif Intell Big Data 119-123 (2019) DOI:10.1109/ICAIBD.2019.8837011.
[38] Li, G.H., Ma, J., Tian, X., Zhao, C., An, S.G., Guo, R. et al. Discrete meta-simulation of silage based on RSM and GA-BP-GA optimization parameter calibration. Processes 11 2784 (2023) DOI:10.3390/pr11092784.
[39] Chen, Y.P., Wu, H.X. Fuzzy neural network controller based on hybrid ga-bp algorithm. Int Conf Comput Control Ind Eng 335-339 (2013) DOI:10.4028/www.scientific.net/AMR.823.335.
[40] Zhao, M.J., Fang, J.J., Zhang, L., Dai, Z., Yao, Z.W. Improving the estimation accuracy of copper oxide leaching in an ammonia-ammonium system using RSM and GA-BPNN. Russ J Non-Ferrous Metals 58 591-599 (2017) DOI:10.3103/s1067821217060177.
[41] Liu, J., Liu, J., Gao, K., Mohagheghian, I., Fan, W., Yang, J., et al. A bioinspired gradient curved auxetic honeycombs with enhanced energy absorption. Int J Mech Sci 291-292 110189 (2025) DOI:10.1016/j.ijmecsci.2025.110189.
[42] Ma, G.G., Sun, Z.J., Ma, H., Li, P.C. Calibration of contact parameters for moist bulk of shotcrete based on EDEM. Adv Mater Sci Eng 2022 6072303 (2022) DOI:10.1155/2022/6072303.
[43] E, D., Wen, Y., Wu, Y., Li, J., Sun, W., Liu, Y., et al. Hydrodynamics of heterogeneous particle swarms in gas-liquid-solid stirred tanks with free surface studied by DEM-VOF. Powder Technol 462 121103 (2025) DOI:10.1016/j.powtec.2025.121103.
[44] Ma, H., Zhou, L., Liu, Z., Chen, M., Xia, X., Zhao, Y. A review of recent development for the CFD-DEM investigations of non-spherical particles. Powder Technol 412 117972 (2022) DOI:10.1016/j.powtec.2022.117972.
[45] Ma, H., Ma, G., Sun, Z., Gao, K., Chen, L. Study on flow characteristics of pneumatic conveying of stiff shotcrete materials by CFD-DEM. Results Eng 26 105129 (2025) DOI:10.1016/j.rineng.2025.105129.
[46] Li, Z.Q., Chen, H.M., Wu, Y.K., Xu, Z.H., Shi, H.Y., Zhang, P. CFD-DEM analysis of hydraulic conveying of non-spherical particles through a vertical-bend-horizontal pipeline. Powder Technol 434 119361 (2024) DOI:10.1016/j.powtec.2024.119361.
[47] Qi, L., Liu, C., Cui, W., Li, Y. Calibration of contact parameters of dem for fresh self-compacting concrete. J Funct Mater 49 7050-7056 (2018) DOI:10.3969/j.issn.1001-9731.2018.07.008.
[48] Zhang, Y., Wang, Z., Xi, M., Zhao, Y., Liu, J. Data-driven prediction of residual flexural capacity in corroded RC beams using PSO and GA-optimized CatBoost ensemble models. Eng Res Express 7 035129 (2025) DOI:10.1088/2631-8695/adfcb3.