


1 INTRODUCTION
Cold roll-beating of tooth profiles is a plastic metal-forming process wherein two high-speed rotating rollers sequentially strike and shape the gear tooth. Despite its high processing efficiency, this method generates various forming defects, including concave tooth tips, flashes, bow-collapses, and surface waviness [1]. Cold roll-beating is a discontinuous forming process. The gear blank undergoes continuous feeding and indexing, while the roller rotates at high speeds. During each rotation, the roller strikes the gear blank once, creating periodic waviness at the tooth root and on the flanks. This phenomenon is inherently determined by the kinematics of the cold roll-beating process and is thus unavoidable, requiring removal via subsequent finishing processes.
Extensive research demonstrates that tooth flank waviness is one of the critical factors impairing gear transmission accuracy, reducing surface strength, and inducing noise. Investigating the mechanism of waviness formation and accurately calculating the associated parameters is of critical significance for controlling waviness errors, enhancing surface precision, and optimizing finishing processes [2-9]. Yin et al. [2] provided insights into the surface waviness formation mechanism in grinding, offering strategies for optimizing industrial grinding applications. Duan et al. [3] proposed a novel method for extracting tooth surface waviness utilizing a Gaussian filter, subsequently analyzing the effects of tooth surface waviness on contact mechanical properties. Tao et al. [4] simulated the evolution of the tooth surface formation process and extracted a waviness model from the simulated topography to analyze the influence of grinding parameters on waviness. Wu et al. [5] analyzed the formation mechanism and optimization method for the surface waviness of TC4 blisk blades. Wang et al. [6] proposed a comprehensive analysis model integrating actual tooth surface reconstruction, contact analysis, and performance evaluation to assess the meshing characteristics of gear teeth exhibiting waviness errors. Tao et al. [7] developed a numerical simulation method for tooth surface waviness in continuous gear grinding (CGG) that incorporates main shaft vibration and grinding worm wear, providing a numerical approach to investigate waviness formation in electric vehicle (EV) gears.
Research in plastic forming of gears focuses on controlling product geometry and dimensional accuracy, understanding stress fields and material flow is therefore essential. Zharov et al. [10] studied the limitations of the finite element (FE) method and their impact on describing workpiece deformation during drastic shape changes, focusing specifically on complex metal flow regions. Their study compared actual product parameters against mathematical modeling results generated by commercial engineering software packages used for the numerical simulation of metal forming and manufacturing processes: MSC Simufact Forming, Transvalor Forge, SFTC DEFORM, and QForm. The results indicated that these software products yielded sufficiently accurate models for studying complex metal flow. Li et al. [11] performed a FE analysis of the roll forming process of straight bevel gears, investigating the metal flow behavior during the formation of “rabbit ear” defects. Similarly, An et al. [12] analyzed the plastic flow direction and the formation mechanism of these defects during the rolling of spiral bevel gears. Deng et al. [13] performed numerical analyses on the hot rolling of spiral bevel gears, determining the distribution characteristics of the strain field. Lin et al. [14] conducted a study on the successive tooth forming process for producing large-modulus spur gears (\(m\) > 2.5 mm). Through FE simulation, they analyzed the stress state and deformation behavior of the gear teeth at each stage of the process. Cui et al. [15] conducted a theoretical investigation into metal flow behavior within the cold roll-beating deformation zone, integrating FE simulation with experimental validation. Kumar et al. [16] employed DEFORM-3D software to investigate roll bite deformation during a plate rolling process for microalloyed steel, detailing the effects of temperature and friction coefficients on stress distribution. Peng et al. [17] investigated the material flow pathways during gear tooth rolling using FE methods. Using FORGE software, Nistor et al. [18] investigated the influence of gear geometry (e.g., tooth number) and the deformation mechanism in terms of teeth forming and forming load evolution. Udupa et al. [19] observed flow behavior during the cutting of metals with a large strain-hardening capacity via high-speed in-situ imaging, proposing a novel flow mode for metal cutting, a sinuous flow. Vandana et al. [20] subsequently investigated the formation mechanism of this sinuous flow and its effect on the geometric configuration of chip deformation via numerical simulations.
Regarding the control of forming defects in cold roll-beating, Ma et al. [1] investigated the formation mechanisms of concave tooth tips, flashes, and bow-collapses, proposing corresponding defect control strategies. Furthermore, Liang et al. [21] developed kinematic equations for the cold roll-beating process and calculated the wave height and wave spacing of the root profile. However, their model neglected the influence of metal plastic flow during the actual machining process, leading to inaccuracies in the calculation results.
Because cold roll-beating is a profile-forming process, the two rollers must be installed such that their generating profiles conform precisely to the tooth groove geometry, i.e., the inter-roller distance (the minimum distance between the rollers) is nominally equal to the diameter of the tooth root circle. Yet, experience from industrial practice consistently shows that the actual inter-roller distance must be slightly smaller than the diameter of the tooth root circle, and the underlying mechanism for this discrepancy has not been investigated or reported.
The principal advance over the model of Liang et al. [21] is the inclusion of plastic material flow when predicting tooth-root waviness. This paper employs an analytical method to calculate the envelope generated by the rollers on the gear blank, thereby deriving the waviness curve at the tooth root. Subsequently, an FE simulation of the cold roll-beating process calculates the simulated waviness curve. Next, by analyzing the metal flow behavior within the deformation zone, this study reveals the formation mechanism of tooth surface waviness and explains why the inter-roller distance in industrial practice is slightly smaller than the diameter of the tooth root circle. Finally, physical cold roll-beating experiments measure the sample’s root waviness curve, validating the computations.
2 METHODS AND MATERIALS
The kinematics of the cold roll-beating process for tooth profiles comprise three primary components: roller rotation, gear blank indexing, and the axial feeding of the gear blank (Fig. 1).
Two rollers rotate at high speeds in opposite directions, striking corresponding positions on the gear blank in strict synchronization, with a rotational angular velocity of \(\omega_g\) [rad/s]. Simultaneously, the gear blank performs an indexing rotation at an angular velocity of \(\omega_p\) [rad/s]; for each full revolution of the rollers, the gear blank automatically rotates by one tooth pitch. Concurrently, the system axially feeds the gear blank at a speed of \(v\) [mm/r] to achieve gradual and uniform deformation. The machine tool’s transmission system maintains the ratio of \(\omega_g\) to \(\omega_p\) strictly equal to the number of gear teeth \(z\), enabling the forming of tooth spaces that match the cross-sectional profile of the roller. Upon contacting the gear blank, friction compels the rollers to roll along the tooth space surface at an angular velocity of \(\omega_r\) [rad/s].
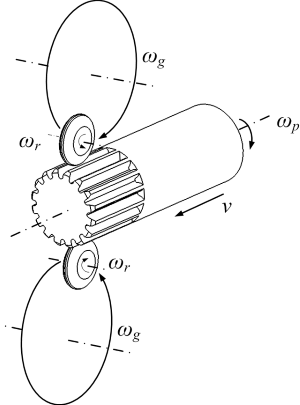
Fig. 1. Forming kinematics of tooth profile cold roll-beating
2.1 Analytical Calculation of the Cold Roll-Beating Waviness Curve
The analytical method determines the envelope generated by the roller on the gear blank during the forming process. Because the process is discontinuous, the continuous axial feeding of the gear blank causes the rollers to generate periodic waviness curves at the tooth root (along the root circle) and across the tooth flanks.
Figure 2 illustrates the resultant waviness curve formed by the roller at the tooth root. For analytical purposes, one can assume the gear blank remains stationary while the rotation center of the roller moves in the direction opposite to the actual gear blank feed. Establishing the roller’s center of rotation during the initial strike as the coordinate origin \(O (0, 0)\) locates the rotation centers during the subsequent two strikes at \(O_1 (−p, 0)\) and \(O_1 (−2p, 0)\). In Figure 2, \(R\) represents the rotation radius of the roller’s center, \(r\) denotes the radius of the roller, points \(B_1\), \(B_2\), and \(B_3\) are the troughs of the waviness curve, points \(A_1\), \(A_2\), and \(A_3\) are the peaks, \(p\) defines the wave spacing, and \(H_b\) represents the wave height.
As the gear blank completes a single revolution, each of the two rollers strikes the same tooth space exactly once. Assuming the gear blank remains completely stationary during contact with the rollers, the wave spacing \(p\) is half of the gear blank’s feed per revolution. Given \(R\) = 80 mm, \(r\) = 20 mm, and \(v\) = 4 mm/r, the wave spacing calculates to \(p\) = 2 mm.
The wave height is calculated using Eq. (1):
This calculation yields \(H_b\) = 0.005 mm.
As shown in Fig. 2, when axial feeding during roller-blank contact is included, Eq. (2) describes the tooth-root contour produced by the first roller strike:
where, \(\theta \in [0, \pi]\).
Upon the subsequent two strikes, Eqs. (3) and (4) define the new contour curves at the tooth root:
where, \(\theta_1 \in [0, \pi]\).
where, \(\theta_2 \in [0, \pi]\).
Because the parametric equations defined by Eqs. (2)–(4) present significant analytical complexity, they were solved graphically.
Figure 3 illustrates the wave height and wave spacing derived via this graphical method. The graphical calculation gives a wave height of 0.005 mm (with an error not exceeding 0.0001 mm) and a wave spacing of 2 mm (with an error not exceeding 0.001 mm). Thus, these results demonstrate that the wave height and wave spacing remain constant. This confirms that the feed of the gear blank during its contact with the rollers has a negligible effect on the wave height and wave spacing.
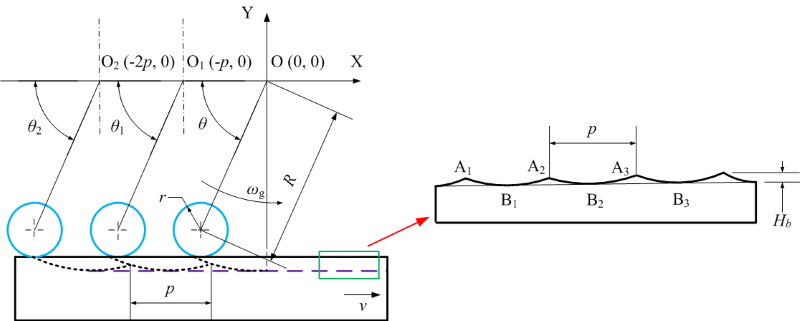
Fig. 2. Waviness curve at the tooth root
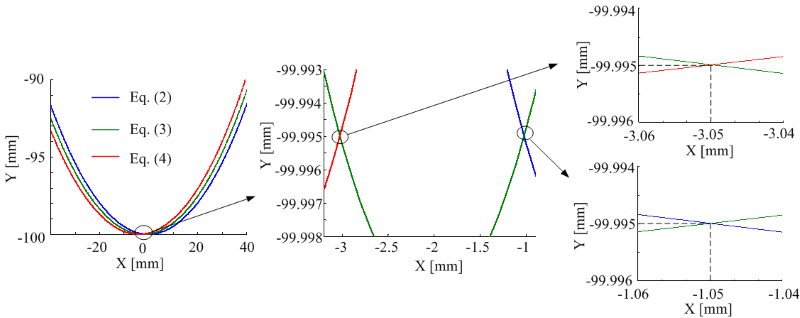
Fig. 3. Wave height and spacing obtained by the graphical method
2.2 FE Simulation of the Waviness Curve
This study establishes a geometric model of the roller for an involute spur gear with a modulus \(m\) of 2 and a tooth count \(z\) of 20, ensuring the roller’s profile curves perfectly coincide with the tooth space profile (Fig. 4a). In Figure 4a, \(r_f\), \(r_b\), and \(r_a\) represent the root circle, base circle, and addendum circle of the gear tooth, respectively. The software converts these geometric models into STL format for importation into the DEFORM-3D pre-processor (Fig. 4b and c). The simulation establishes a spatial rectangular coordinate system with its origin at the gear blank’s geometric center. The X-axis coincides with the axis of the blank, and the Y-axis serves as the symmetry axis of the profile curve of the tooth space formed by the roller.
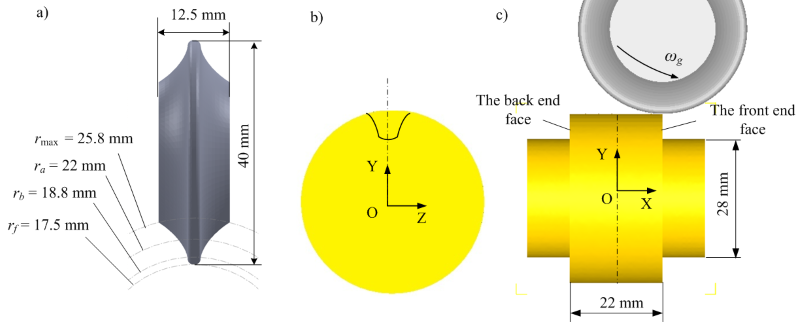
Fig. 4. FE models in the DEFORM-3D preprocessor
The FE model and preprocessing parameters follow the authors’ earlier methodology [1], with the following settings:
- The rotation speed of the roller is \(ω_g\) = 2000 r/min, the indexing angular speed of the gear blank is \(ω_p\) = 100 r/min, the feeding speed of the gear blank is \(v\) = 4 mm/r, and the rotation radius of the roller’s center is \(R\) = 80 mm;
- Neglecting the elastic deformation of the roller and the elastic restitution of the gear blank material, the roller is modeled as a rigid body, and the blank as a plastic body. The gear blank material is specified as the AL-1100 aluminum alloy, and its constitutive model is retrieved from the material library integrated within the software;
- The gear blank is meshed, and local mesh refinement is applied in the main deformation zone to generate tetrahedral elements. The total number of elements is 217,967, and the minimum edge length is 0.1797 mm;
- Cutting fluid is used in the cold roll-beating process, so the contact can be considered pure rolling between the roller and the gear blank. To simplify the calculation, the friction coefficient between the roller and the blank is set to 0.
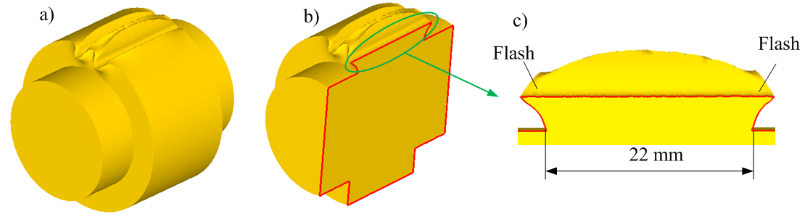
Fig. 5. FE simulation results; a) simulated tooth profile, b) blank sectioning along the tooth space center, and c) tooth root contour
The simulation results are presented in Fig. 5. Flashes formed at both ends of the gear blank will require removal in subsequent machining processes. Because the effective tooth width is 22 mm, the analysis strictly considers the domain \(X\) ∈ [‒11, 11].
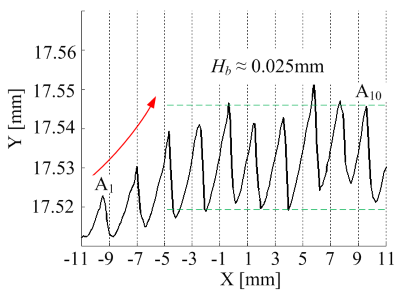
Fig. 6. Waviness curve at the tooth root derived from FE simulation
Utilizing the DEFORM-3D post-processor’s slicing tool, the analysis sections the gear blank along the tooth space center to extract the contour curve (Fig. 5b and c). The contour curve is then magnified, and 210 nodes are manually selected, point by point, using the Point Tracking function. The corresponding nodal coordinates are exported to MATLAB and connected via straight-line segments to generate the waviness curve, without applying any curve-fitting algorithm (Fig. 6):
- Within the range of \(X\) ∈ [‒11, 11], the process generates 10 complete waviness cycles, which is perfectly consistent with the actual manufacturing scenario;
- The wave height is slightly smaller near the front and back end faces (\(X\) = ± 11 in Fig. 4), but gradually increases and stabilizes, reaching a maximum of approximately 0.025 mm;
- Extracting the X-coordinates of wave peaks \(A_1\) (−9.38) and \(A_{10}\) (9.47) allows for the calculation of the mean wave spacing: \(\bar{p}\) = 2.09 mm;
- Within a single waviness cycle, the rising edge of the curve exhibits a gentler slope than the falling edge;
- Both peaks and troughs lie above the nominal tooth root circle (17.5 mm), with wave troughs measuring specifically 0.02 mm higher.
As shown in Fig. 6, the simulated root wave spacing is generally consistent with the value calculated by the analytical method, while the simulated wave height is significantly larger than the analytical result. This critical discrepancy necessitates an analysis of the metal flow behavior during the cold roll-beating forming process.
3 RESULTS
3.1 Slip-Line Field in the Metal Deformation Zone
The cold roll-beating process resembles rigid-cylinder sliding over a plastic deforming surface or ploughing by a rounded cutting-tool, but also includes normal indentation. However, it is more complex. The roller not only slides along the surface of the gear blank but also indents into it. Based on the slip-line field model for a cylinder sliding along a smooth surface [22,23], Fig. 7 illustrates the approximate structure of the slip-line field within the cold roll-beating deformation zone.
The dimensions of the roller are significantly larger than those of the metal deformation zone. Approximating arcs CB and C‘B as straight lines allows one to model the cold roll-beating process as an oblique indentation by a wedge-shaped body. The indentation direction aligns with the linear velocity direction of the roller, i.e., forming an angle \(\alpha\) with the X-axis. Hill’s solution for oblique wedge indentation [24] is applied by equating the indentation depth to the length of segment OB. This requires the area of region COB to equal region CAD, and the area of region C’OB to equal region C’A’D’. Consequently, the volume of metal bulging ahead of the roller exceeds the volume bulging at the rear.
As the roller advances, \(\alpha\) decreases continuously. When \(\alpha\) decreases to 0, the roller contacts the tooth root circle. Because the frontal metal bulge rises above the tooth root circle, the process transitions to a ploughing regime, maintaining the slip-line field structure illustrated in Fig. 7. Subsequently, as the roller ascends from the tooth root circle toward the wave peak, \(\alpha\) becomes negative. The roller eventually reaches the analytically calculated wave peak (points \(A_1, A_2,\) or \(A_3\) in Fig. 2). Even at this point, the ploughing regime persists because point A on the free boundary remains higher than the peak itself. The roller continues its trajectory until it exits the metal deformation zone. At this juncture, point \(A\) ceases its upward displacement, thereby establishing the final peak of the waviness curve on the free boundary.
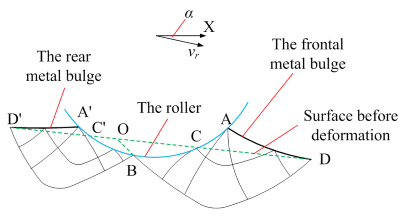
Fig. 7. The slip-line field model in the cold roll-beating deformation zone
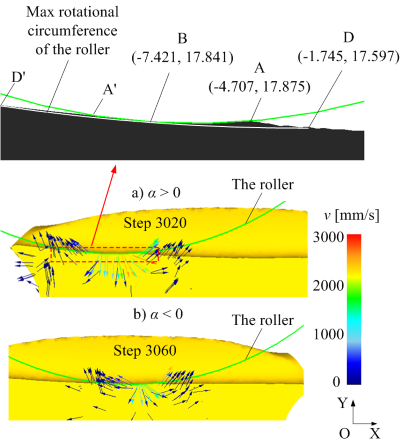
Fig. 8. Velocity vectors of metal particles in the deformation zone; a) α>0, and b) α<0
3.2 FE Simulation Analysis of the Metal Deformation Zone
Slip-line field theory is a classical method for plane-strain plasticity, but cannot directly model the three-dimensional deformation considered here. Examples of these include variable cross-sections and curved surface contacts. When addressing complex practical problems, the slip-line field theory is frequently utilized as a qualitative analysis tool or as a supplementary method to the FE method. Extracting data via the DEFORM-3D post-processor yields the velocity vector distribution of the metal particles (Fig. 8). Particles ahead of the roller move forward and bulge upward. In contrast, particles at the rear move backward and simultaneously bulge upward. Notably, the frontal particles exhibit a higher bulging velocity than the rear particles. When α takes a negative value, the kinematic motion states of the metal particles both ahead of and at the rear of the roller remain directionally consistent. However, their motion velocities decrease. Magnifying the deformation zone in Fig. 8a allows for the extraction of the frontal metal bulging curves (arc AB and curve AD). Additionally, it reveals the rear metal bulging curves (arc A’B and curve A’D’). Observation confirms that while both regions exhibit bulging, the frontal height significantly exceeds the rear height.
Figure 8 indicates that the position and geometric configuration of the deformation zone derived from the FE simulation are largely consistent with the theoretical slip-line field presented in Fig. 7. Furthermore, it shows that the pronounced frontal metal bulging serves as the primary mechanism driving surface waviness formation.The post-processor extracts the precise coordinates of points A, B, and D (Fig. 8a). Calculations show that the distance between points A and B along the X-direction is 2.714 mm, while the distance between points A and D along the X-direction is 2.962 mm. Notably, both of these values exceed the nominal wave spacing (\(p\) = 2 mm). This discrepancy indicates that the bulging curves of the metal deformation zone (arc AB and curve AD) exhibit mutual overlap during the formation of the surface waviness.
3.3 Discussion of Results
- The waviness curve derived from the analytical method represents the theoretical kinematic envelope generated by the roller on the gear blank. Because this approach omits actual material flow behavior, it fails to accurately capture the true physical state of the forming process. Conversely, the FE simulation visualizes the dynamic evolution of the deformation zone. Accordingly, the derived waviness curve (Fig. 6) is significantly more reliable.
- The final waviness curve results from the continuous overlapping of the frontal metal bulging curves, as shown in Fig. 9. Following this overlapping, the wave trough rests higher than the tooth root circle. This phenomenon explains why the inter-roller distance in actual production must be slightly smaller than the tooth root circle diameter. Concurrently, the overlapping process decreases the height of the frontal metal bulging curves. This effective height is denoted \(H_b′\) and satisfies \(H_b′ > H_b\).
- As shown in Fig. 9, the roller governs the AB segment of the frontal metal bulging curve, forming a circular arc with a radius of \(R + r\). As the gear blank feeds along the X-axis, the roller drives the material to accumulate against the previously formed bulge region. This accumulation exerts a negligible influence on the rising edge of the waviness curve. However, it significantly affects the falling edge, rendering it much steeper.
- Because the material accumulation state remains highly consistent during each roller strike, the resulting wave spacing exhibits no significant variation.
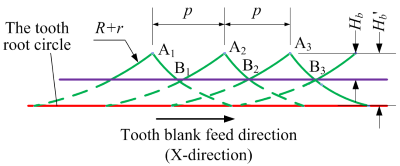
Fig. 9. Overlapping of the frontal metal bulging curves
3.4 Waviness Curves on the Tooth Flank
Periodic waviness occurs at both the root and the flank. Rotating the simulated gear blank from Fig. 5a counterclockwise by 18° renders the tooth profile symmetric about the Y-axis. Establishing two slicing planes at heights of \(Y\) = 18.8 mm and \(Y\) = 20 mm yields two corresponding slicing curves on the tooth flank (Fig. 10). The methodology samples 210 points along the X-direction from each curve to generate the two waviness curves presented in Fig. 11, without applying any curve-fitting algorithms.
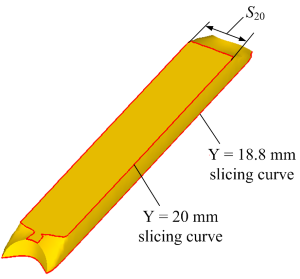
Fig. 10. Slicing curves on the tooth flank
Both curves in Fig. 11 show a bow-shaped trend, with lower values near the ends and higher values at midspan. This shape is attributable to bow-collapse. Previous research by the authors detailed this bow-collapse phenomenon [1]. Bow-collapse represents a macro-scale shape defect. In contrast, tooth surface waviness is an intermediate-scale geometric feature on the gear surface, characterized by periodic undulations between macroscopic form errors and microscopic roughness. Given their distinct characteristics, this study strictly analyzes the waviness curve corresponding to the gear blank’s middle region.
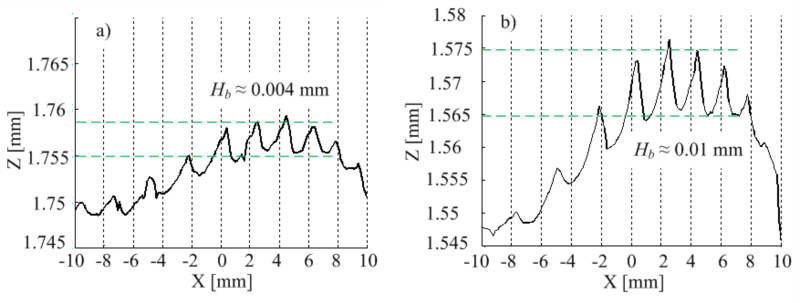
Fig. 11. Waviness curves on the tooth flank; a) Y = 18.8 mm, and b) Y = 20 mm
On the tooth flank at \(Y\) = 18.8 mm, approximating the base circle (\(r_b\) = 18.8 mm), the wave height measures approximately 0.004 mm with a wave spacing of 2 mm.
Similarly, on the tooth flank at \(Y\) = 20 mm, approximating the pitch circle (\(r\) = 20 mm), the wave height increases to approximately 0.01 mm while maintaining a wave spacing of 2 mm.
The rising edges of both waviness curves remain relatively gentle, whereas the falling edges are steeper. This profile is consistent with the tooth root waviness curve.
In Figure 11, the Z-coordinate of each point on the waviness curve must be equal to half of the chordal tooth thickness. Equation (5) determines the chordal tooth thickness of the standard spur tooth profile at the two slicing planes:
where \(S_Y\) denotes the chordal tooth thickness; \(H_Y\) represents the Y-coordinate values of the two slicing planes; \(\alpha_Y\) is the local pressure angle; and \(\alpha\) is the pressure angle on the pitch circle (\(\alpha\) = 20°).
Equation (6) expresses the pressure angle \(\alpha_Y\):
where \(r_Y\) is the radius of the circle intersecting the slicing planes.
In Equations (5) and (6), the subscript denotes the physical quantity’s value at the corresponding Y-coordinate. For instance, \(S_{20}\) (Fig. 10) represents the chordal tooth thickness at \(Y\) = 20 mm.
Substituting Eq. (6) into Eq. (5) yields an equation with \(S_Y\) as unknown. Solving this equation via MATLAB yields \(S_{18.8}\) = 2×1.75 mm and \(S_{20}\) = 2×1.55 mm.
Comparing these values to those in Fig. 11 reveals that the wave trough at the \(Y\) = 18.8 mm slicing plane is 0.005 mm larger than the standard tooth profile, while the wave trough at the \(Y\) = 20 mm slicing plane is 0.015 mm larger.
4 EXPERIMENTAL MEASUREMENT OF WAVINESS CURVE
Experiments on a custom-built cold roll-beating machine were conducted to assess the proposed mechanism and FE predictions. The process subjects the sheet material to cold roll-beating under strictly controlled conditions that do not compromise the verification integrity.
4.1 Experimental Parameters Configuration
The custom-built cold roll-beating testing machine is retrofitted from a horizontal milling machine, which lacks an indexing motion mechanism and can only provide the rotational motion of the roller and the continuous feeding motion of the gear blank. Since the roller contacts the gear blank for only a very short period during one rotation, the influence of indexing motion on the tooth surface is negligible. Considering the load capacity of the testing machine, the rotation speed of the roller is set to 480 r/min and the feeding speed of the gear blank is set to 960 mm/min, yielding an effective feed of 2 mm per roller revolution.
A spur rack was cold-roll-beaten from a 20-mm-thick AA1100 aluminum-alloy sheet. The top surface dimensions of the gear blank measure 120 mm × 40 mm. The dimensions of the roller test specimen are presented in Fig. 12, which enables the simultaneous formation of three tooth spaces on the gear blank. The intermediate tooth space is subjected to loading conditions that most closely resemble the actual working conditions, and its waviness curve can be measured for comparison with the results of FE simulation.
The penetration depth of the roller is set to the tooth space depth (4.5 mm, as shown in Fig. 12), consistent with the FE simulation condition in which the inter-roller distance equals the tooth root circle diameter.
No lubricant is applied during the experiment, and high-speed bearings are installed at both ends of the roller to minimize the friction coefficient. This configuration ensures good agreement with the boundary conditions defined in the FE simulation.
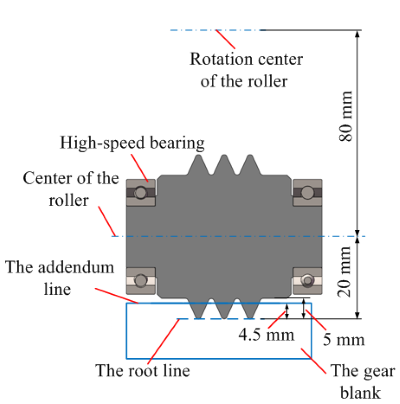
Fig. 12. The dimensions of the roller test specimen
4.2 Measurement of Waviness Curve
A gear blank specimen is fabricated, and four cold roll-beating experiments are conducted on it, resulting in the formation of 12 tooth spaces. Inspection indicates that the tooth spaces formed in the first and second experiments possess relatively good surface quality. The intermediate tooth space from the second experiment is sectioned for metallographic analysis, and the waviness curve of the intermediate tooth space from the first experiment is measured.
A Leica DCM3D white-light confocal microscope is used to measure the sample’s tooth root waviness curve. A 3D surface topography scan is performed at the tooth root of the tooth space in the middle region of the gear blank to extract the waviness curve. Operational parameters are detailed in Table 1. Figure 13 displays the testing apparatus, the experimental sample, and the resulting measurements.
Table 1. Operational parameters of Leica DCM3D white-light confocal microscope
| Measurement mode | Confocal |
|---|---|
| Objective magnification | 20× |
| Optical resolution (X /Y) [μm] | 0.28 |
| Vertical resolution (Z) [nm] | < 15 |
| The number of images averaged per Z-scan step | 5 |
The experimental results in Fig. 13 show the following:
- The sample’s wave height measures approximately 0.028 mm, which is in close agreement with the FE simulation result (0.025 mm);
- Within a single wave period, the rising edge remains relatively gentle, while the falling edge is steeper, directly mirroring the FE simulation result;
- The wave spacing of the sample‘s waviness curve measures approximately 2 mm, which also aligns with the FE simulation result.
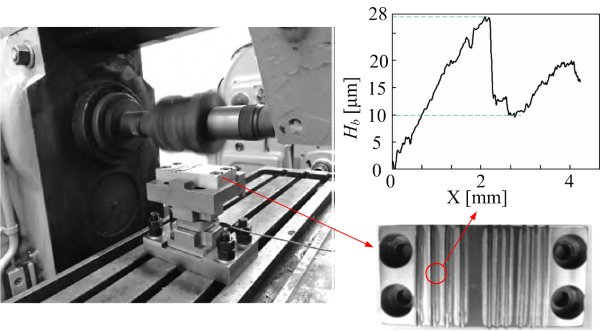
Fig. 13. The cold roll-beating testing machine, sample, and measured waviness curve
5 CONCLUSIONS
- This study calculated the tooth root waviness curve using both analytical kinematics and FE simulation. The FE-derived wave height is significantly larger than that obtained by the analytical method, and the simulated wave trough is significantly higher than the nominal tooth root circle.
- Establishing a slip-line field model for the deformation zone allowed for an in-depth analysis of the surface waviness formation mechanism. FE simulations investigated the material flow behavior within this zone, yielding results highly consistent with the slip-line analysis. The FE simulation results indicate that the pronounced bulging of metal ahead of the roller is the primary cause for the formation of surface waviness. Consequently, the analytical method based on cold roll-beating forming kinematics fails to accurately predict the waviness curves because it neglects this plastic material flow.
- The final cold roll-beating waviness curve is formed by the continuous overlapping of these frontal metal bulging curves, which results in the tooth root being higher than the nominal tooth root circle and an increase in effective tooth thickness. This physical mechanism also explains why, in actual production, the inter-roller distance is set slightly smaller than the diameter of the tooth root circle.
- Physical validation experiments conducted on a custom-built cold roll-beating testing machine successfully measured the actual sample’s tooth root waviness. The wave height, wave spacing, and curve morphology obtained from the experiments are all consistent with the FE simulation results, thus supporting the FE prediction of waviness magnitude and morphology under the tested conditions.
References
- Ma, Q., Cha, L., Zhang, X. Simulation research on the control method of bow-collapse in gear cold roll-beating. Stroj Vestn-J Mech E 70 426-439 (2024) DOI:10.5545/sv-jme.2023.884.
- Yin, T., Du, H., Zhang, G., Hang, W., To, S. Theoretical and experimental investigation into the formation mechanism of surface waviness in ultra-precision grinding. Tribol Int 180 108269 (2023) DOI:10.1016/j.triboint.2023.108269.
- Duan, L., Du, W., Wang, L., Yu, W., Chen, Z., Gu, F. et al. Time-varying transient EHL behaviors of spur gear pairs considering tooth waviness extracted by gaussian filter. Tribol Int 210 110758 (2025) DOI:10.1016/j.triboint.2025.110758.
- Tao, Y., Li, G., Wang, Y., Yu, H., Sun, Y., Zhao, X. Effect of grinding parameters on tooth surface waviness in continuous generating grinding for electric vehicle gears. J Manuf Process 115 323-341 (2024) DOI:10.1016/j.jmapro.2024.02.015.
- Wu, D., Wang, H., Zhang, K., Lin, X. Research on formation mechanism and optimization method of surface waviness of TC4 blisk blade. J Manuf Process 39 305-326 (2019) DOI:10.1016/j.jmapro.2019.02.031.
- Wang, Y., Li, G., Tao, Y., Zhao, X., He, X. Loaded tooth contact analysis for helical gears with surface waviness error. Mech Syst Signal Process 224 112045 (2025) DOI:10.1016/j.ymssp.2024.112045.
- Tao, Y., Li, G., Wang, Y. Numerical investigation on tooth surface waviness in continuous generating grinding of electric vehicle gears considering the main shaft vibration and grinding worm wear. Precis Eng 91 242-254 (2024) DOI:10.1016/j.precisioneng.2024.09.015.
- Yang, Y., Wu, Y., Tsai, T. An analytical method to control and predict grinding textures on modified gear tooth flanks in CNC generating gear grinding. Mech Mach Theory 177 105023 (2022) DOI:10.1016/j.mechmachtheory.2022.105023.
- Böttger, J., Kimme, S., Drossel, W. Characterization of vibration in continuous generating grinding and resulting influence on tooth flank topography and gear excitation. Proc CIRP 99 208-213 (2021) DOI:10.1016/j.procir.2021.03.029.
- Zharov, M.V., Preobrazhenskii, E.V. Accuracy assessment of plastic metal flow modeling in commercial finite element software. J Appl Mech Tech Phys 66 811-821 (2025) DOI:10.1134/S0021894425700361.
- Li, D., Zhang, S., Yang, X., Ma, H., Sun, S. Numerical investigation on roll forming of straight bevel gear. Int J Adv Manuf Technol 107 1517-1537 (2020) DOI:10.1007/s00170-020-05004-7.
- An, X., Sun, L., Zhao, N., Jiang, C., Wang, L., Zhang, B. A novel and robust hot rolling forming method for spiral bevel gears. J Manuf Process 141 1705-1715 (2025) DOI:10.1016/j.jmapro.2025.03.072.
- Deng, J., Jiang, C., Deng, X., Liu, S., Liu, S. Analysis and experimental study of metal streamline configuration in hot rolling forming of spiral bevel gears. Int J Adv Manuf Technol 120 1653-1662 (2022) DOI:10.1007/s00170-022-08863-4.
- Lin, Y., Wu, T., Wang, G. Simulation and experimental study on a new successive forming process for large modulus gears. Chin J Mech Eng 34 127 (2021) DOI:10.1186/s10033-021-00653-5.
- Cui, F., Su, Y., Xie, K., Wang, X., Ruan, X., Fei, L. Analysis of metal flow behavior and residual stress formation of complex functional profiles under high-speed cold roll-beating. Adv Mater Sci Eng 9672768 (2018) DOI:10.1155/2018/9672768.
- Kumar, A., Rath, S., Kumar, M. Simulation of plate rolling process using finite element method. Mater Today Proc 42 650-659 (2021) DOI:10.1016/j.matpr.2020.11.050.
- Peng, B., Luo, Y.X., Wang, H., Niu, T., Wang, Y.Q. Investigation on the effects of tooth profile deviation in gear rolling process. Int J Adv Manuf Technol 126 1877-1887 (2023) DOI:10.1007/s00170-023-11207-5.
- Nistor, L., Neag, A., Marian, I., Frunza, D. Experimental and numerical simulation study of simultaneous toothing of spur gears by press-rolling process. J Manuf Sci Eng 138 121015 (2016) DOI:10.1115/1.4034493.
- Udupa, A., Viswanathan, K., Ho, Y., Chandrasekar, S. The cutting of metals via plastic buckling. Proc R Soc A 473 20160863 (2017) DOI:10.1098/rspa.2016.0863.
- Vandana, A.S., Sundaram, N.K. Simulation of sinuous flow in metal cutting. Tribol Lett 66 94 (2018) DOI:10.1007/s11249-018-1047-5.
- Liang, X., Li, Y., Yang, M., Yuan, Q., Feng, J., Zhang, R. Analysis and modification on characterization parameter of surface scale-texture for cold roll-beating forming parts. Mech Sci Technol Aerosp Eng 35 606-613 (2016) DOI:10.13433/j.cnki.1003-8728.2016.0420.
- Busquet, M., Torrance, A. A numerical slipline field for the sliding cylinder problem. Wear 241 86-98 (2000) DOI:10.1016/S0043-1648(00)00360-4.
- Busquet, M., Torrance, A. Investigation of surface deformation and damage when a hard cylindrical asperity slides over a soft smooth surface. Tribol Ser 36 101-109 (1999) DOI:10.1016/S0167-8922(99)80032-7.
- Hill, R. The Mathematical Theory of Plasticity. Oxford University Press, Inc. (1950) Oxford.