


1 INTRODUCTION
The automotive industry is under constant pressure to improve product quality while simultaneously reducing production costs [1,2]. Achieving these objectives requires the implementation of advanced methods for monitoring and analysing key performance indicators (KPIs), which enable accurate measurement of production performance [3,4]. Business and technological processes (BTP) management enables organizations to respond to changes and maintain adaptability in dynamic market environments [5]. Prior research demonstrates that structured process management (PM) improves organizational efficiency, productivity, and employee performance, thereby enhancing customer service and contributing to the achievement of strategic objectives [6-9].
Business processes are generally classified into management, core, and support processes [10]. Within core processes, technological processes such as preparation and assembly are particularly important because they focus on optimizing resource utilization to meet production targets [11]. Performance measurement and PM are closely interconnected, especially in manufacturing environments where process repeatability and stability are essential [12]. Technological processes are deeply integrated with other core activities and have a direct impact on overall production performance [10].
In automotive production environments, particularly in the manufacturing of daytime running lights (DRL), technological processes require a high level of repeatability due to tight tolerances and interdependent process parameters. Variations in process conditions directly affect product conformity and process stability, leading to increased variability and reduced efficiency across technological and operational performance.
Although previous studies have addressed individual performance indicators, integrated empirical analyses of process capability (Cpk), overall equipment effectiveness (OEE), and return on investment (ROI) in real manufacturing environments remain limited [13-15]. As a result, these indicators are predominantly treated as independent measures, which restricts the ability to systematically explain how variability at the technological level propagates through operational performance and affects financial outcomes.
This research introduces an integrated business and technological processes (BTP) monitoring system developed for the production of DRL in the automotive industry. The system enables real-time tracking and control of technological processes and supports the analysis of preparation and assembly subprocesses. Special attention is given to defining measurable and verifiable performance indicators that enable continuous monitoring of process stability, operational efficiency, and financial performance.
The main objectives of the study are to (i) develop a comprehensive system for monitoring KPIs in automotive manufacturing, (ii) empirically investigate the relationships between Cpk, OEE, and ROI, and (iii) implement an automated measurement system that supports real-time process monitoring and decision-making.
To reach these objectives, the present study investigates the relationships between technological process capability, operational equipment effectiveness, and financial performance within an integrated monitoring framework implemented in an automotive production environment. The study addresses the following research question: What is the relationship between the technological indicators Cpk and OEE and the financial indicator ROI? Within this framework, it is hypothesized that process capability (Cpk) is positively associated with OEE (H1), that Cpk is positively associated with financial performance measured by ROI (H2), and that operational effectiveness OEE mediates the relationship between Cpk and ROI (H3). The study contributes to the understanding of how technological, operational, and financial indicators can be integrated within a single monitoring framework in automotive manufacturing.
2 BACKGROUND
Measuring the performance and effectiveness of BTP is crucial for manufacturing organizations. However, there are shortcomings in current measurement systems that suffer from improperly integrated technology processes [16]. In manufacturing environments, monitoring systems that combine technological and business indicators are often aligned with the principles of manufacturing execution systems (MES), which act as an intermediary layer between shop-floor operations and enterprise-level management. MES enables real-time data acquisition, performance tracking, and decision support, and is a key component of Industry 4.0 architectures [17].
The theoretical background of the problem focuses on the management of technological processes by measuring their efficiency and effectiveness, which provides effective control and enables corrections [18]. The dynamic business environment requires performance measurement systems to keep pace with constant changes in strategies and measurement methods. In addition to traditional methods, new methods are emerging, such as business activity monitoring (BAM) [3] and service oriented architecture (SOA) [19]. In the automotive industry, quality management systems are increasingly aligned with the requirements of the IATF 16949 standard, which emphasizes process standardization, defect prevention, and continuous improvement in production systems [20]. In parallel, new artificial intelligence methods are being developed to support the monitoring and optimization of technological processes [21].
A technological process involves a sequence of activities performed in a specific order to reach a goal. To manage such processes effectively, it is crucial to employ suitable methods and tools for control, monitoring, error detection, and correction. These include business process analysis and diagnosis [22], selecting KPIs [16], process monitoring and control [23], fault detection and correction, and change management [3,24]. Additionally, Hyötyläinen [24] and Brocke and Schmiedel [25] addressed issues related to relational capital, absorptive capability, process reliability, and maintenance management. Their research highlighted the importance of measuring technological process performance to gain a competitive advantage. Durivage [13] and Horenbeek and Van Pintelon [22] explored various methods, including modeling and simulation, the analytic network process (ANP), and the balanced scorecard (BSC), to assess and monitor technological performance processes.
The technological processes analyzed in the automotive case include the assembly of DRLs parts and related procedures, such as bolting, bonding, and final inspection. The bolting process employs various tools, like automatic bolting machines, to achieve the proper torque, bolting duration, and number of turns. Durivage [13] discussed processes of primary importance in the automotive industry and presents an example of statistical methods for process evaluation and improvement. The bonding process in the automotive industry requires precise measurement of parameters like adhesive temperature, component temperature, adhesive mass, and bonding time. This final aspect is essential for balancing the overall technological process with other manufacturing operations and for comparing quality and productivity [26,27]. The final inspection, as the last step in the production process, ensures product quality [1]. Different methods and tools are used to inspect and test the product, including the use of an ANP to select performance indicators and a systems approach to diagnose the current state of quality management systems and business processes [22,28]. In the automotive industry, assembly, bolting, bonding, and final inspection are key processes that require precise parameter monitoring to ensure quality and efficiency. Many authors [13,22,26,28] have presented various approaches and methods, including statistical techniques, measurement of parameters (torque, time, revolution number, temperature, mass, and timing), and the use of tools to inspect and test the product [29,30]. Shandilya et al. [30] provided empirical evidence for improving defect rates and process capability (Cp or Cp/Cpk) in other processes using red bin analysis, which has proven more effective than Six Sigma in 50 % of industries. The process capability index Cp evaluates the potential capability of a statistically stable process by comparing process variability with specification limits, whereas Cpk additionally accounts for the deviation of the process mean from the target value [27,31,32]. The define-measure-analyze-improve-control approach was also utilized to establish statistical control [33]. After conducting a process capability study (Cp, Cpk), it was found that all values remained within the specified limits.
Several authors investigated the process of genuine resistance breaking points and their suitability for assessing the process capability of Y9T calliper cutting parameters. The results show that increasing process capability (Cp, Cpk) alters the production rate per batch [34]. Further studies aimed to maximize the lowest Cpk values for ingredients while maintaining blend costs at predefined levels; varying cost levels result in varying ideal Cpk values. A new stochastic nonlinear model has been constructed with the chance-constrained method [35].
The authors proposed a strategy for normal inspection to be restarted if any lot is rejected during the sample inspection [36]. Nevertheless, it also permits a lower degree of normal inspection if higher product quality is shown. The operational characteristic function of the proposed plan is derived using the precise sample distribution of the predicted Taguchi capability index (Cpm) which evaluates process capability while simultaneously accounting for process variability and deviation from the target value, and provides recommendations for potential modifications to enhance Cp and Cpk effectiveness.
Process capability indices assess the ability to monitor processes and are crucial in quality control, as they quantitatively establish the relationship between actual process performance and specified product requirements in many industries [27,31]. Variable Cpk is a key indicator to evaluate how well a manufacturing process performs within predefined specification limits. It is essential in production environments where repeatability, precision, and stability are critical [13,37,38]. According to ISO 22514-1 [39], a consistently stable process should achieve a minimum Cpk of 1.33 [40]. Previous studies [27,29] demonstrated that increasing Cpk reduces defects, but the benefits of further improvements diminish beyond a certain point. Shivaramu [29] has implemented advanced predictive model maintenance based on machine learning to transition from reactive to proactive maintenance, thereby enhancing process stability (Cp, Cpk) and OEE.
In addition to Cp and Cpk indices, the process performance index (Ppk) was evaluated. While Cpk reflects the potential capability of a stable process under controlled conditions, Ppk measures the actual long‑term performance of the process by considering overall variation over time. Comparison between Cpk and Ppk, therefore, indicates whether the process remains statistically stable during extended production periods. Pavlin [15] reached similar conclusions regarding the production of DRL, where process stability significantly improved operational performance; however, further increases in Cpk yielded limited additional gains.
OEE combines three key components: availability, performance, and quality [41]. In the automotive industry, OEE is commonly used to identify losses caused by equipment downtime, reduced speed, and quality problems. Achieving high OEE depends on technological upgrades, process optimization, and the accurate tracking of process deviations [42]. Stable processes, characterized by high Cpk values, are fundamental for sustaining long-term OEE improvements [14,15,29]. Gomaa [43] proposed a framework that significantly enhances supply chain management efficiency, OEE, Cpk, and customer satisfaction. Several authors [14,15,29] found that increasing Cpk in real production environments directly contributes to higher OEE by reducing process variability and enhancing parameter stability.
ROI remains a critical metric for evaluating the financial effectiveness of investments in technological upgrades and process improvements [16,44]. It was noted that investments focused on equipment, without improving process stability, often fail to deliver the expected returns [42]. Solangi and Magazzino [45] investigated the pivotal function of ROI in assessing the appeal and viability of investments in renewable energy. Effective ROI monitoring requires an integrated view that considers process and financial indicators, which was confirmed with ROI integration in measurement systems being closely linked to process stability and OEE improvements [14,15].
Traditionally, performance indicators such as Cp, Cpk, OEE, and ROI have been analyzed independently, but recent studies highlight the importance of monitoring these indicators within integrated systems [42]. Real-time process monitoring supports faster decision-making and more effective corrective actions [3]. A BTP system that enables real-time tracking of the relationships between Cpk, OEE, and ROI in an automotive manufacturing setting was developed [46]. This integrated approach enables the detection of process deviations more quickly and enhances decision-making accuracy [27].
Lean production, six sigma, and total productive maintenance remain foundational methodologies for continuous improvement in the automotive industry [41,47], which alone do not ensure immediate detection of process deviations. More authors [28,42] emphasized that continuous KPIs monitoring is essential for achieving sustainable performance. Pavlin [15] introduced an integrated system capable of detecting real-time process changes, supported by automated measurement technologies that enable faster responses and improve process stability [46]. The importance of detecting minimal deviations, particularly in high-precision manufacturing with tight tolerances, was emphasized [48]. Based on these findings, the present study examines the integration of Cpk, OEE, and ROI within a real automotive manufacturing environment as part of a continuous improvement framework.
3 METHODS
The study was conducted in a Slovenian automotive company specializing in the production of DRL. The primary objective was to develop an integrated system for real-time monitoring of business and technological processes (BTP system), connecting Cpk, OEE, and ROI indicators [14,15]. The production process was divided into three critical phases: component preparation, product assembly, and final visual and functional inspection. These stages were selected due to their direct influence on product quality, process stability, and overall manufacturing efficiency [15].
3.1 Design and Implementation of the Measurement System
The measurement system was developed following ISO 22514-1 [39] and ISO 22514-7 [49], ensuring continuous monitoring of process parameters. The system was supported by automated measurement points, enabling real-time data acquisition.
The implementation proceeded in three phases:
Phase 1: Manual data collection for basic monitoring and initial process assessment.
Phase 2: Gradual introduction of automated measurement points to increase accuracy and reduce human error.
Phase 3: Full automation, enabling real-time tracking of Cpk, OEE, and ROI.
Research measurements adhered strictly to ISO 22514-7 [49], ensuring compliance with the minimum number of measurements per operation and providing robust, statistically reliable results [15,49]. The following key indicators were monitored to assess process capability (Cpk): Functional compliance of the product if acceptable of unacceptable [OK/NOK], documentation compliance [OK/NOK], and dimensional accuracy [mm].
Measurements were performed using specialized equipment, including automated photometers, torque sensors, temperature probes, adhesive application systems, and automatic data loggers. In total, over 1,400 measurements were conducted, with each technological operation measured at least 100 times. To ensure data reliability, measurements were carried out by two independent teams [50].
When process instability or deviations from tolerance limits were detected, several optimization loops were performed. Each loop consisted of four sequential stages: identification of deviations from specification limits through statistical analysis of measured parameters; diagnostic analysis of root causes, including evaluation of machine settings, measurement system reliability, and process conditions; implementation of corrective technical interventions, such as adjustment of machine parameters, calibration of measurement equipment, mechanical alignment of assembly fixtures, or partial redesign of production devices, and verification measurements to confirm that the implemented improvements achieved the required process capability level. All additional measurements were performed in accordance with ISO 22514-1 [39] and IATF 16949 [20]. OEE was monitored through equipment availability, production process performance, and product quality. ROI was evaluated based on investments in measurement systems and corresponding savings achieved through improved production efficiency [14,15]. The measurement procedure was developed in line with [51] recommendations, with a strong focus on reliability and repeatability. Both basic instruments (scales, thermometers, stopwatches) and advanced equipment (coordinate measuring machines) were used. At least 750 measurements were performed to analyze the technological assembly process, which included fifteen operations. An additional 250 measurements were conducted in the final assembly stage to verify functional compliance, dimensional accuracy, and product quality.
To ensure the robustness of the dataset, measurements were carried out across different time intervals and by alternating teams, minimizing operator bias and random error. All data collection followed ISO 22514-7 [49], which defines the minimum measurement requirements per operation. When deviations or instabilities were detected, iterative optimization cycles were conducted, including technical adjustments and targeted re-measurements to restore process stability.
Collected data underwent initial validation for accuracy and completeness. The selected KPIs (Cpk, OEE, and ROI) were examined to confirm their suitability for analyzing technological, operational, and financial performance dimensions [52]. Cpk data were analyzed using Minitab software [27,40,53], with a particular focus on process stability. OEE was calculated according to [41,42] methodology, and ROI was determined based on actual cost savings [2,45] achieved through reduced downtime, improved quality, and increased productivity [15]. Correlation and regression analyses were conducted using SPSS to evaluate the relationships between Cpk, OEE, and ROI, with particular attention to direction, significance, and practical interpretation. Statistical significance was evaluated at the 0.05 level.
3.2 Key Features of the Methodological Approach
The research employed a quantitative approach with a high level of measurement accuracy, combining automated monitoring with repeatable measurements to ensure reliable results [52].
The main methodological strengths include:
- Real-time detection of process deviations using an automated measurement system.
- High measurement precision achieved through calibrated equipment and standardized procedures.
- Integration of technological and business indicators to provide comprehensive process monitoring.
- Practical applicability of the measurement system, fully adapted to real-world conditions in the automotive industry.
The collected data provides a solid foundation for monitoring process stability, operational efficiency, and investment profitability, supporting the long-term optimization of manufacturing processes.
3.3 Research Model of Correlations
The research model defines the relationships between technological, operational, and financial performance indicators in the context of DRL assembly within an automotive manufacturing environment. It examines Cpk OEE, and ROI as indicators of process stability, equipment-level operational performance, and financial outcomes observed during the monitored production period. A conceptual research model (Fig. 1) was developed to structure these relationships and support empirical analysis.
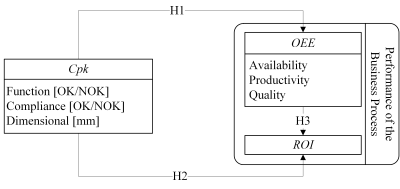
Fig. 1. Conceptual research model linking technological, operational, and financial performance indicators Cpk, OEE, and ROI
In the proposed model, Cpk represents the capability and stability of technological processes, OEE reflects the operational effectiveness of production equipment, and ROI captures the financial outcomes of process performance. In the analyzed DRL production system, these indicators are derived from repeated measurements of functional compliance, documentation compliance, and dimensional accuracy, as well as from real-time monitoring of equipment availability, performance, and quality during production shifts.
Improvements in process capability, achieved through successive optimization cycles, are assumed to influence operational effectiveness by stabilizing process conditions and improving product conformity. However, OEE may also be affected by additional operational factors, such as equipment availability and production dynamics. Improved operational effectiveness is directly reflected in financial outcomes, as measured by ROI. Within this framework, OEE is considered a mediating mechanism linking technological process capability and financial performance, as supported by prior studies [14,28,42].
To enable empirical testing, the model is operationalized through the following hypotheses:
H1: Cpk is positively associated with OEE.
H2: Cpk is positively associated with financial performance measured by ROI.
H3: OEE mediates the relationship between Cpk and ROI.
The model is examined using a longitudinal case study approach based on real production data collected during multiple optimization phases of the DRL assembly process. The relationships are evaluated using correlation and regression analysis, with particular attention to their strength, direction, and statistical significance [54,55].
4 RESULTS
4.1 Sample Description
This study analyzed a sample specifically chosen to assess key BTP indicators, including installation and startup times and costs, operational cycles, optimization loops, and total and component-specific scrap rates. Process robustness was evaluated using Cpk analyses based on dimensional and functional measurements. The dataset comprised at least 50 consecutively produced units from 14 different assembly operations, totaling a minimum of 700 measurements for each optimization loop. Initial analyses showed that the process frequently exceeded tolerance limits during startup. To address this, three optimization cycles were carried out, each including repeated measurements to improve stability and ensure conformity with product specifications. This iterative adjustment of process parameters resulted in better product quality and a noticeable reduction in scrap rates.
All measurements adhered to ISO 22514-7 [49], which mandates a minimum of 50 measurements per operation, ensuring thorough data collection for each optimization loop. The Cpk analyses focused on attributes affecting overall quality, production time, and costs, even if they weren’t directly linked to the product’s primary requirements. Due to the extensive nature of the data, only the Cpk optimization results are presented.
4.2 Critical Process Capability
In this study, several process indicators are used to evaluate the capability of different production functions. The abbreviations 2L, 3L, 2R, and 3R denote specific measurement stages and component positions within the DRL assembly process. The letter L refers to measurements performed on left-side assembly units, while R refers to measurements performed on right-side assembly units. The numerical labels indicate the process optimization stage (i.e., 2 for the 2nd optimization phase, and 3 for the 3rd), enabling a structured comparison of process capability indicators before and after the final optimization phase. In addition to Cp and Cpk, Ppk is also reported. Ppk evaluates the overall process performance by considering the total variation of the process over time, including both short-term and long-term variability [32,56]. Unlike Cpk, which assumes a statistically controlled process, Ppk reflects the actual performance of the process under real operating conditions. The Cpk is a statistical measure used to evaluate how close the process is operating to the specification limits, considering standard deviation (σ) and process mean (μ) [32,56] as calculated in Eq. (1):
where [13] USL is upper specification limit, LSL lower specification limit, X nominal value, σ standard deviation, and μ process mean.
A higher Cpk value (>1.33) signifies that the process can produce products within the specification limits with minimal variation, reflecting good process performance [56,57]. In this study, technological and measurement processes, with particular attention to Cpk indicators, were defined. Measurement and performance monitoring occurred over 12 months, which is typical for complex processes [58-60]. Non-optimal processes require multiple phases of optimization and re-measurement. Optimizing the measurement system was the initial step, followed by addressing the necessary repairs and restorations to the equipment. A large number of measurements were conducted, providing a robust dataset for the analysis of preparation and assembly processes [20].
Identified deficiencies required systematic optimization efforts, with particular emphasis on stabilizing the measurement process to ensure accuracy and process reliability. Corrective actions included equipment adjustments, repairs, restoration activities, and, in some cases, partial redesign of production devices based on data obtained during the investigation of production equipment. A substantial volume of Cpk related data was integrated into the BTP measurement system, improving process understanding and supporting further process enhancements. In the analysis of the final assembly operation, 250 measurements were performed [20] to verify compliance with the required technical standards. Measurements were conducted both directly in production using industrial measuring instruments and in the company laboratory under controlled conditions. When process stability deviations were identified, additional optimization phases and repeated measurements were implemented until the required level of process stability and product quality was achieved.
During the testing phase, particular attention was given to the three principal components of OEE: availability, performance, and quality. A nominal production target of 1,172 products per 7.16-hour shift was established as the operational benchmark. Measurement activities were conducted over a three-week period following the second production-line optimization and continued across 50 production shifts after three additional optimization phases.
The technological processes were assessed using Cpk indicators, which evaluate process capability and stability. Statistical analysis indicated that optimizations reduced the standard deviation. For example, the torque measurements before optimization comprised 100 measurements, split into two sets of 50 for the left and right sides. These measurements were repeated the following day to minimize potential errors, with each set containing 50 sequential measurements. The initial measurements showed very similar standard deviations, which aligned with expectations. The tightening optimization process performed during the DRL assembly process involved iterative adjustment of process parameters through three optimization cycles until the required process capability was achieved, resulting in stable operating conditions, as demonstrated by an identical standard deviation of 0.003 for both the left and right assembly sides after optimization.
Further analyses using Minitab and SPSS software did not reveal statistically significant correlations between certain Cpk indicators and OEE. This result should not be interpreted as evidence that the process is insensitive to operational variation. Instead, it indicates that OEE is influenced by multiple operational factors beyond technological process capability, including equipment availability, maintenance practices, and production scheduling. Consequently, while high Cpk values confirm the stability and capability of the technological process, OEE reflects a broader set of operational conditions within the production system.
Regression analysis was used to explore the relationships between individual Cpk indicators and OEE, providing additional statistical insight into the observed patterns. Based on these findings, it can be concluded that improvements in process capability contribute to increased process stability and product quality, where operational effectiveness, measured by OEE, may also depend on additional operational factors, such as equipment availability, maintenance practices, and production scheduling. This improves reliability and consistency in production and reduces the likelihood of process-related deviations under varying operating conditions. This systematic approach to optimizing BTP is vital for further development and improvements within the company, as it enables precise monitoring and adjustment of processes in real time [46].
The effects of the optimization process were evaluated by comparing process capability indicators obtained during Optimization 2 and Optimization 3 for the analyzed technological functions. During the process Optimization 2 for Function 2L, the following process capability indicators were analyzed: Cp = 1.356, Cpk = 1.341, and Ppk = 1.347 (Fig. 2). These values indicate an improvement in process performance; however, the Cpk remains below the required reference value of 2. Even though the values of Cp and Cpk indicate that the process was well-centered within the specifications, further improvement was needed [27,53].

Fig. 2. a) Functions comparison at: a) 2L, and b) 3L
After Optimization 3, the values were Cp = 2.650, Cpk = 2.612, and Ppk = 2.652, as shown in Fig. 2. All of these values exceed the critical threshold of 2, indicating a significant improvement in process performance. The near-identical Cp and Cpk values suggest that the process is well-centered, while the similarity between Cpk and Ppk indicates a statistically controlled process with minimal deviations or variability that meets the required quality standards [20].
Figure 2 presents the results of the Cpk analysis, showing data from Optimization 2 (Fig. 2a) and from Optimization 3 (Fig. 2b). The results from Optimization 3 also represent the final optimization of the process capability indicator for functions 2L and 3L (the technical specification requires a minimum Cpk = 2). In Fig. 2, USL and LSL define the specification boundaries used to evaluate the dimensional and functional conformity of the analyzed DRL assembly operations. The indices Cp and Cpk quantify short-term process capability, where the small difference between Cp and Cpk confirms that the process mean remained close to the target value during Optimization 3. The one-sided capability indices CPU and CPL indicate balanced process performance relative to the upper and lower specification limits. In addition, the performance indices Pp and Ppk were used to evaluate long-term process behavior under actual production conditions, while PPU and PPL represent the corresponding upper and lower long-term performance measures, and Cpm is Taguchi capability index [27,32,39,53]. The close agreement between capability and performance indices observed in Optimization 3 indicates low process drift and stable production conditions throughout the monitored production period.
The optimization 3 indicators for Compliance 3L and 3R are compliant with the technical requirements (documentation compliance) prescribed by UN/ECE R87 and VDA [61,62] in comparison to Compliance 2L and 2R (Fig. 3).

Fig. 3. Compliances at: a) 2L, and b) 3L
Figure 3 illustrates the results of the Cpk analysis, with the data from Optimization 2 on the left and Optimization 3 on the left. The results from Optimization 3 represent the outcome of the process capability indicator optimization for Compliance 2L and 3L (technical specification requires a minimum Cpk = 2). Compliance was the second process indicator measured and analyzed. After Optimization 2, the recorded values were Cp = 1.288, Cpk = 1.239, and Ppk = 1.245. These values indicated an improvement in process performance, but Cpk still fell short of the required standard. Despite Cp and Cpk being relatively close, suggesting that the process was reasonably well-centered, the optimization was insufficient to meet all performance requirements. Following Optimization 3, the indicator values significantly increased, with Cp = 3.943, Cpk = 3.924, and Ppk = 3.944. These values demonstrated that the process exceeded the required standards, as all metrics were well above the reference limits. Additionally, the near-identical values of Cp, Cpk, and Ppk indicated a stable, well-centered, and statistically controlled process with minimal deviations that meets all requirements for process performance and stability [20].

Fig. 4. Dimensional at: a) 2L, and b) 3L
Figure 4 presents the indicator values for dimensional accuracy optimizations Dimensional_3L, which are significantly greater than those for optimizations Dimensional_2L. Figure 4 illustrates the results of the Cpk analysis, with the data from Optimization 2 on the left and Optimization 3 on the left. The results from Dimensional 3 also represent the outcome of the process capability indicator dimensional accuracy optimization for Dimensional 2L and 3L (technical specification requires a minimum Cpk = 2). Dimensional accuracy was the third process indicator measured and analyzed. After Optimization 2, the recorded values were Cp = 0.541, Cpk = 0.487, and Ppk = 0.489. These values indicated poor process performance, as all indicators were significantly below the required level; the process was not properly centered and exhibited substantial deviations. Following Optimization 3, the values showed significant improvement: Cp = 2.811, Cpk = 2.793, and Ppk = 2.808. These higher values demonstrated that the process was well-centered and met all required quality standards. The close alignment of Cp, Cpk, and Ppk values indicated a stable and statistically controlled process. The third optimization successfully ensured that the Dimensional accuracy indicator achieved a high level of performance and stability, and that all three analyzed indicators exceeded the required capability thresholds [20].
4.3 Business and Technological Processes: Validation
According to the ISO 9001:2015 [50], companies must validate all BTPs for which process compliance cannot be verified by subsequent monitoring and measurement. A total of 1,400 measurements were made for the baseline indicators, with each technological process being measured 100 times. One team completed the first 50 measurements; to prevent measuring errors, the teams were switched and completed the remaining 50 measurements. The team rotation approach ensured higher data reliability. The regression results, together with the Cpk analysis conducted in Minitab, indicate that improved process capability was associated with greater process stability and product consistency. However, the observed relationships with broader performance indicators should be interpreted with caution, since operational outcomes may also be influenced by additional technical and organizational factors [20].
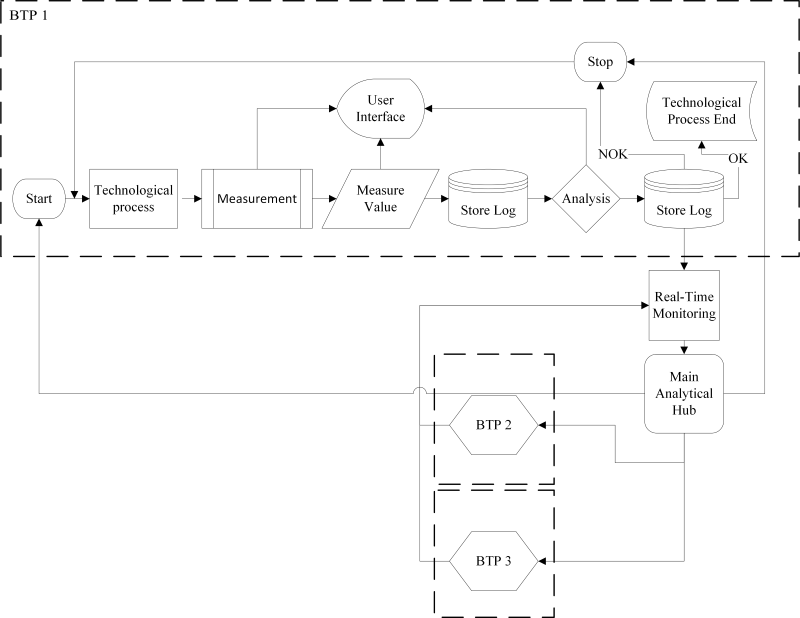
Fig. 5. Architecture of the developed real-time monitoring system for BTP
The basic model for BTP monitoring is shown in Fig. 5. In practice, the model includes connections in all directions and monitoring of every measurable parameter of the technological process. Only the KPIs that were defined at the beginning, based on technical requirements and suitability analysis, were analyzed; other measured indicators, in addition to KPIs, were only recorded. The steps include: measurements and evaluation of measurements, storing data in LOG for further analysis, visualization of data via graphical display, generation of commands for possible process adjustments based on analysis, and optimization and re-analysis if inconsistencies are detected.
BTP 2 and BTP 3 follow the same procedure as BTP 1, but are not shown in full. Each BTP includes measurement, evaluation, analysis, and optimization of processes, enabling comprehensive monitoring of multiple technological processes simultaneously.
Figure 5 shows the architecture of the real-time monitoring system developed for BTP. It is designed to support automated data collection (KPIs, Cpk, OEE, ROI) and cross-process feedback within a multi-stage production environment. Although not traditional, the system adheres to the logic and functional structure of MES as employed in Industry 4.0 environments [17,22].
4.4 Evaluation of Equipment Effectiveness and Return on Investment
To evaluate the effectiveness of technological process improvements, two widely accepted performance indicators were analyzed: OEE and ROI. OEE is a composite metric to assess equipment performance (availability, performance rate, quality), as defined by [41]. ROI is a key financial indicator that quantifies the profitability of investments, particularly in manufacturing improvements and automation [11,63].
Data were collected over 50 production shifts for both the second and third optimization phases of the process. OEE values were calculated following the standard approach shown in Eq. (2):
- Availability: Ratio between actual runtime and planned production time.
- Performance: Ratio between actual output and theoretical maximum output.
- Quality: Ratio of defect-free units to total units produced.
OEE is expressed as a percentage and calculated as shown in Eq. (2) [41]:
For financial evaluation, ROI was determined using Eq. (3) [63]:
Although ROI is conventionally expressed as a ratio, in this study it is operationalized as cumulative financial return [€], due to confidentiality constraints preventing disclosure of detailed investment data.
In the second optimization phase, ROI was calculated using only the number of produced units that complied with the technical product specifications. Because the process capability had not yet reached the required level at this stage, the calculated value represents an intermediate economic estimate rather than the final return of the production system. After the third optimization, when the technological process achieved the required capability level and the planned daily production volume, the calculated ROI reflects the actual financial performance of the optimized production process.
In this study, the reported financial values represent the cumulative financial return generated through process optimization during the observed production period. These benefits include reductions in scrap costs, improved productivity, decreased equipment downtime, and improved product quality. The initial investment primarily consisted of expenditures related to the implementation of automated measurement systems, sensor integration, and data monitoring infrastructure. While ROI is formally defined in Eq. (3), the financial values presented in the results section represent the cumulative economic effects achieved following the implementation of technological and organizational improvements within the analyzed DRL production system.
The second optimization phase resulted in an OEE of 78.36 %, while the third phase increased this value to 85.41 %. Improvements were observed across all three OEE dimensions: availability rose from 89.66 % to 91.98 %, performance from 0.898 to 0.921, and quality from 0.971 to 0.986. These results indicate greater production reliability, reduced variability, and better process control. Simultaneously, the calculated financial benefits increased from €2,915,182 after the second optimization to €7,978,259 after the third optimization, corresponding to a 175.04 % increase of financial benefit. The value reported for the second optimization represents an estimated return based only on the number of products that met the required technical specifications at that stage of the process. Because the technological process had not yet fully achieved the prescribed capability requirements, this value represents only an intermediate economic estimate rather than the final financial performance of the production system. The financial result obtained after the third optimization reflects the actual return achieved once the required technical specifications and the planned daily production capability were reached.
To further examine the relationship between operational effectiveness and financial outcomes, a linear regression analysis was performed with OEE as the predictor and ROI as the dependent variable as shown in Table 1. The result indicates that a one-percentage-point increase in OEE is associated with an average increase of approximately 9.56 units in financial return within the analyzed production system.
Table 1. Linear regression analysis predicting financial performance (ROI)
| Predictor | B | SE | β | t | p | 95 % CI |
|---|---|---|---|---|---|---|
| Constant | 822.96 | 6.31 | — | 130.35 | <0.001 | [810.26-835.65] |
| OEE | 9.56 | 0.07 | 0.999 | 129.13 | <0.001 | [9.41-9.71] |
| Model statistics | ||||||
| R | R² | Adjusted R² | F-value | p-value | n | Durbin-Watson |
| 0.999 | 0.997 | 0.997 | 16673.86 | <0.001 | 50 | 1.36 |
where B is unstandardized regression coefficient; SE standard error of the regression coefficient; β standardized regression coefficient; t t-statistic; p statistical significance level; 95 % CI = 95 % confidence interval; R correlation coefficient; R² coefficient of determination; adjusted R² adjusted coefficient of determination; n number of observations. The Durbin–Watson statistic was used to assess autocorrelation of regression residuals [52,54].
Linear regression analysis revealed a very strong positive relationship between OEE and financial performance (ROI). The model was statistically significant (R = 0.999, R² = 0.997, F = 16673.86, p < 0.001, n = 50). The results indicate that increases in OEE are associated with proportional increases in financial benefits generated by the production process. Because ROI is calculated based on production output and product conformity, a strong relationship between operational effectiveness and financial outcomes is expected. These findings indicate that the technological improvements, particularly automation and improved process monitoring, were associated with measurable economic benefits through improved operational and financial performance as shown in Table 2 [14,15,25,64].
Table 2. KPIs after optimization phases
| Optimization Phase | OEE [%] | Availability [%] | Performance | Quality | ROI [€] |
|---|---|---|---|---|---|
| Optimization 2 | 78.36 | 89.66 | 0.898 | 0.971 | 2,915,182 |
| Optimization 3 | 85.41 | 91.98 | 0.921 | 0.986 | 7,978,259 |
OEE reflects production equipment operational effectiveness. The financial values presented in the last column represent the cumulative financial return generated by process optimization during the respective production phases. The value reported for Optimization 2 was calculated based only on the number of products that met the required technical specifications at that stage of the process and represents an intermediate economic estimate. The value reported for Optimization 3 reflects the actual financial outcome obtained after the technological process achieved the required capability level and planned daily production capability. The first optimization phase was excluded due to insufficient Cpk performance.
These findings validate the model’s capability to improve manufacturing performance through integrated KPIs monitoring and substantiate the financial return of strategic investments in production optimization.
5 DISCUSSION
The findings of this study confirm that enhancing Cpk improves process stability and product quality in automotive manufacturing [20]. This is consistent with previous studies emphasizing process stability and defect reduction [14,15,27].
In the analyzed DRL production system, the increase in Cpk after the third optimization phase was directly associated with fewer defective products and improved overall quality, highlighting the practical importance of continuous monitoring of process parameters [14,15].
Despite these improvements in process stability, no statistically significant correlation between Cpk and OEE was identified using Minitab and SPSS [53,54]. Correlation analysis revealed weak relationships between OEE and the individual process measurements used to evaluate process capability. Statistically significant negative correlations were observed for functional compliance (r = −0.327, p = 0.010) and documentation compliance (r = −0.267, p = 0.030), whereas no significant relationship was found for dimensional accuracy (r = −0.012, p = 0.468). These results indicate that improvements in individual process measurements do not necessarily result in proportional improvements in overall equipment effectiveness.
This finding can be explained by the composite structure of OEE, which integrates availability, performance, and quality components [41]. While improvements in Cpk primarily affect process stability and product quality, OEE is simultaneously influenced by additional operational factors, including equipment availability, maintenance practices, and production scheduling [42]. Consequently, high Cpk values primarily contribute to the quality component of OEE, whereas other operational factors may constrain overall equipment effectiveness.
The results further indicate that improvements in process stability support financial performance, particularly through ROI [14]. ROI evaluation must account for risks associated with unstable processes [16]. In the analyzed case, the implementation of real-time monitoring and multi-stage optimization reduced process variability and enabled the realization of expected financial returns from investments in measurement and control systems.
The proposed integrated monitoring model combines technological indicators (Cpk), operational indicators (OEE), and financial indicators (ROI) within a unified performance monitoring framework. Although the conceptual model assumes relationships between these indicators, the empirical results demonstrate that these relationships are not strictly linear. Improvements in process capability primarily influence process stability and product quality, while operational performance is additionally affected by equipment-related and organizational factors. The model should therefore be interpreted as a framework for integrated monitoring rather than a deterministic causal structure.
A comparison with the overall equipment effectiveness monitoring system (OEEMS) [65] shows that the developed model extends existing approaches by integrating technological and financial indicators alongside operational performance. While OEEMS focuses primarily on real-time OEE monitoring, the proposed framework incorporates Cpk and ROI, enabling a broader analysis of production system performance in real industrial conditions.
These findings reinforce the importance of integrating technological and business performance indicators within a unified monitoring system [14,28,41]. Continuous improvement approaches emphasize the need for rapid detection of process deviations [47,48], which was achieved in this study through automated measurement and iterative optimization cycles. The practical implementation of an integrated monitoring system linking Cpk, OEE, and ROI has demonstrated measurable improvements in production stability, quality, and operational effectiveness [15,42].
From the perspective of the research hypotheses, the results indicate that the relationships between technological, operational, and financial indicators are complex. Improvements in process capability were associated with improved operational conditions and financial performance; however, not all direct statistical relationships between the variables were confirmed. These findings suggest that technological stability, operational effectiveness, and financial outcomes should be interpreted as interconnected dimensions of manufacturing performance. Because this study is based on a single industrial case and limited statistical modelling, the observed relationships should be interpreted as empirical patterns within the analyzed production system rather than as universally generalizable causal relationships.
6 CONCLUSIONS
This study demonstrates that integrated monitoring of Cpk, OEE, and ROI provides an empirically validated framework for optimizing manufacturing processes in an automotive production environment. Improvements in process capability achieved during the final optimization phase resulted in enhanced product quality, reduced variability, and increased process stability, supported by real-time monitoring and automated data acquisition. The findings indicate that relationships between technological, operational, and financial indicators are interconnected but not strictly linear. Although improvements in Cpk were associated with more stable process conditions, no statistically significant direct relationship between Cpk and OEE (H1) was identified, suggesting that operational effectiveness is influenced by additional technical and organizational factors [41,42]. In contrast, OEE exhibited a strong and statistically significant relationship with ROI, confirming its role as a key operational link between technological process improvements and financial outcomes (H2).
From a hypothesis-testing perspective, the results provide differentiated support for the proposed relationships. Process capability improvements were reflected in both operational and financial performance, although not all relationships were statistically verified as direct effects. In this context, OEE can be interpreted as an operational mechanism linking technological improvements to financial performance (H3).
The study contributes by empirically integrating technological, operational, and financial indicators within a unified monitoring framework, thereby extending existing approaches to performance measurement in manufacturing systems [14,15,46]. The findings are consistent with prior research emphasizing the importance of process stability, OEE-based evaluation, and continuous improvement [28,41,42].
The main limitations relate to single-case design and the use of correlation-based analysis, which constrain generalizability and causal interpretation. Future research should validate the proposed framework across multiple production environments and apply advanced analytical methods to further examine causal relationships between BTP indicators.
References
- Sousa, S., Rodrigues, N., Nunes, E. Evolution of process capability in a manufacturing process. J Man Analytics 5 95-115 (2018) DOI:10.1080/23270012.2018.1436988.
- Pieniak, D., Otrocki, M., Gil, L., Walczak, A., Przystupa, K., Kilikevičius, A. Evaluation of surface functional properties of polymeric sliding materials for lubricated metal-polymer pairs applications. Stroj Vestn-J Mech E 71 258-266 (2025) DOI:10.5545/sv-jme.2024.1188.
- Janiesch, C., Matzner, M., Müller, O. Beyond process monitoring: a proof-of-concept of event-driven business activity management. Bus Proc Man J 18 625-643 (2012) DOI:10.1108/14637151211253765.
- Kaplan, R.S., Norton, D.P. Alignment. Harvard Business School Publishing, Boston (2006).
- Verle, K., Markič, M. Top Management Competencies and Organization as the Basis for Organizational Success, University of Primorska, Faculty of Management Koper (2012). (in Slovene)
- Adamides, E.D. Linking operations strategy to the corporate strategy process: a practice perspective. Bus Proc Man J 21 267-287 (2015) DOI:10.1108/BPMJ-07-2013-0107.
- Choong, K.K. Are PMS meeting the measurement needs of BPM? A literature review. Bus Proc Man J 19 535-574 (2013) DOI:10.1108/14637151311319941.
- Gębczyńska, A. Strategy implementation efficiency on the process level. Bus Proc Man J 22 1079-1098 (2016) DOI:10.1108/BPMJ-01-2016-0004.
- Kohlborn, T., Mueller, O., Poeppelbuss, J., Roeglinger, M. New frontiers in business process management (BPM). Bus Proc Man J 12 3-6 (2014) DOI:10.1108/BPMJ-02-2014-0015.
- Harmon, P. Business Process Change. Morgan Kaufmann Publishers Oxford (2007) DOI:10.1016/B978-0-12-374152-3.50072-0.
- Johnson, H.T., Kaplan, R.S. The Rise and Fall of Management Accounting. Harvard Business School Press (1987) Boston.
- Neely, A. The performance measurement revolution: why now and what next? Int J Oper & Prod Man 19 205-228 (1999) DOI:10.1108/01443579910247437.
- Durivage, M.A. Practical Engineering, Process, and Reliability Statistics. Quality Press, Milwaukee (2014).
- Janeš, A., Pavlin, R. Optimization of Business and Technological Processes. University of Primorska Press, Koper. (2024) (in Slovene)
- Pavlin, R. Management and Monitoring of Business and Technological Processes. PhD Thesis, University of Primorska Faculty of Management, Koper (2024). (in Slovene)
- Neely, A., Gregory, M., Platts, K. Performance measurement system design: A literature review and research agenda. Int J Oper & Prod Man 15 80-116 (1995) DOI:10.1108/01443579510083622.
- Mohamed, M.M., Alraddadi, A.S. Agile factor flexible Industry 4.0 with MES manufacturing execution system along with ERP back-end integration: ready-made garments as a case study. Amer J Operat Res 14 137-150 (2024) DOI:10.4236/ajor.2024.144007.
- Melnyk, S.A., Bititci, U., Platts, K., Tobias, J., Andersen, B. Is performance measurement and management fit for the future? Manage Account Res 25 173-186 (2014) DOI:10.1016/j.mar.2013.07.007.
- Malatras, A., Asgari, A.(H)., Baugé, T., Irons, M. A service-oriented architecture for building services integration. J Facil Man 6 132-151 (2008) DOI:10.1108/14725960810872659.
- 16949:2016. Quality management system requirements for automotive production and relevant service parts organizations. International Automotive Task Force, Brussels.
- Simonič, M., Palčič, I., Klančnik, S. Advancing intelligent toolpath generation: A systematic review of CAD-CAM integration in Industry 4.0 and 5.0. Stroj Vestn-J Mech E 71 328-336 (2025) DOI:10.5545/sv-jme.2025.1370.
- Horenbeek, A., Van Pintelon, L. Development of a maintenance performance measurement framework – using the analytic network process (ANP) for maintenance performance indicators election. Omega 42 33-46 (2013) DOI:10.1016/j.omega.2013.02.006.
- Das, A., Maiti, J., Banerjee, R.N. Process monitoring and fault detection strategies: a review. Int J Qual & Reliab Man 29 720-752 (2012) DOI:10.1108/02656711211258508.
- Hyötyläinen, T. Steps to Improved Firm Performance with Business Process Management: Adding Business Value with Business Process Management and its Systems. Springer Gabler, Wiesbaden (2015) DOI:10.1007/978-3-658-07470-8.
- vom Brocke, J., Schmiedel, T. BPM-Driving Innovation in a Digital World. Springer (2015) Heidelberg, DOI:10.1007/978-3-319-14430-6.
- Agostini, L., Nosella, A., Soranzo, B. Measuring the impact of relational capital on customer performance in the SME B2B sector: The moderating role of absorptive capacity. Bus Proc Man J 23 1144-1166 (2017) DOI:10.1108/BPMJ-10-2016-0205.
- Kwilinski, A., Kardas, M. Enhancing process stability and quality management: A comprehensive analysis of process capability indices. Virt Econ 6 73-92 (2024) DOI:10.34021/ve.2023.06.04(5).
- Garza-Reyes, J.A. A systematic approach to diagnose the current status of quality management systems and business processes. Bus Proc Man J 24 216-233 (2018) DOI:10.1108/BPMJ-12-2016-0248.
- Shivaramu, P. Optimizing Manufacturing processes with predictive maintenance using machine learning and lean six sigma. SSRN Electr J 1-25 (2025) DOI:10.2139/ssrn.5161097.
- Shandilya, S., Arora, J., Kalluri, V. To study the comparison and effect of six sigma and red bin analysis in Indian manufacturing industries. TQM J 35 1658-1685 (2023) DOI:10.1108/TQM-04-2022-0116.
- Aslam, M., Rao, G., Ahmad, L., Jun, C. A new control chart using GINI CPK. Commun Stat-Theor M 51 197-211 (2022) DOI:10.1080/03610926.2020.1746971.
- Juran, J.M., Godfrey, A.B., Hoogstoel, R.E., Schilling, E.G. Quality Control Handbook. McGraw-Hill, New York (1974).
- Kulkarni, S.D., Prasanna, N.D., Mirunalini, S., Akshaya, C., Reddivari D., Kousalya, N., Agalya, A. Enhancing the process capability of machining process of boring tool holder by application of six sigma methodology. Mater Today-Proc 52 329-338 (2022) DOI:10.1016/j.matpr.2021.09.043.
- Pawar, H.U., Bagga, S.K., Dubey, D.K. Investigation of production parameters for process capability analysis: A case study. Mater Today-Proc 43 196-202 (2021) DOI:10.1016/j.matpr.2020.11.627.
- Sakalli, Ü.S., Burak Birgören, B. Joint optimization of quality and cost in brass casting using stochastic programming. Eng Optimiz 52 1645-1657 (2020) DOI:10.1080/0305215X.2019.1668933.
- Suthersan, P., Balamurali, S. Optimal designing of skip-lot sampling plan with a provision for reducing the normal inspection using the Taguchi process capability index. Qual Eng 1-15 (2024) DOI:10.1080/08982112.2024.2359591.
- Down, M, Czubak, F., Gruska, G., Stahley, S., Benham, D. Measurement Systems Analysis: Reference Manual. Automotive Industry Action Group, Southfield. (2010).
- Sharma, G.V.S.S., Rao, P.S., Babu, B.S. Process capability improvement through DMAIC for aluminum alloy wheel machining. J Ind Eng Int 14 213-226 (2018) DOI:10.1007/s40092-017-0220-z.
- ISO 22514-1:2014. Statistical Methods in Process Management–Capability and Performance Part 1. International Organization for Standardization (ISO), Geneva.
- Tsarouhas, P., Sidiropoulou, N. Application of Six Sigma methodology using DMAIC approach for a packaging olives production system: a case study. Int J Lean Six Sigma 15 247-273 (2024) DOI:10.1108/IJLSS-06-2022-0140.
- Nakajima, S. Introduction to TPM: Total Productive Maintenance. Productivity Press (1988) Minnesota.
- Puvanasvaran, A.P., Mei, C.Z., Alagendran, V.A. Overall equipment efficiency improvement using time study in an aerospace industry. Procedia Engineer 68 271-277 (2013) DOI:10.1016/j.proeng.2013.12.179.
- Gomaa, A.H. Achieving operational excellence in manufacturing supply chains using lean six sigma: a case study approach. Int J Lean Six Sig 17 614-648 (2026) DOI:10.1108/IJLSS-03-2024-0045.
- Du, D., Li, Y., Song, J., He, Z., Xu, J. Two-stage optimal design of metro underframe structures: based on topology-size-shape co-optimization methodology. Stroj Vestn-J Mech E 71 381-388 (2025) DOI:10.5545/sv-jme.2025.1308.
- Solangi, A., Magazzino, C. Evaluating financial implications of renewable energy for climate action and sustainable development goals. Renew Sust Energ Rev 212 115390 (2025) DOI:10.1016/j.rser.2025.115390.
- Pavlin, R., Janeš, A. Monitoring technological processes in the automotive industry. Chall Futur 9 21-51 (2024) DOI:10.37886/ip.2024.002. (in Slovene)
- Bhasin, M.L. Creative accounting practices in the Indian corporate sector: An empirical study. Int J Man Sci Bus Res 4 35-52 (2015).
- Maurer, O., Herter, F., Bähre, D. Tolerancing the laser powder bed fusion process based on machine capability measures with the aim of process control. J Manuf Proc 80 659-665 (2022) DOI:10.1016/j.jmapro.2022.06.031.
- ISO 22514-7:2021 Statistical Methods in Process Management–Capability and Performance Part 7. International Organization for Standardization, Geneva (2021).
- ISO 9001:2015. Quality Management Systems – Requirements. International Organization for Standardization, Geneva.
- Kaplan, R.S. Conceptual Foundations of the Balanced Scorecard. Harvard Business School, Harvard University, Boston (2010) DOI:10.2139/ssrn.1562586.
- Hair, J.H., Babin, B.J., Anderson, R.E., Tatham, R.L. Multivariate Data Analysis. Pearson Prentice Hall, New Jersey (2006)
- Minitab. Getting Started with Minitab Statistical Software. (2024) Minitab, from support/minitab.com/minitab, accessed on 2024-07-12.
- Field, A. Discovering Statistics Using IBM SPSS Statistics. SAGE Publications, London (2018).
- Hamel, J., Dufour, S., Fortin, D. Case Study Methods. Sage Publications, Newbury Park (1993) DOI:10.4135/9781412983587.
- Kane, V.E. Process capability indices. J Qual Technol 18 41-52 (1986) DOI:10.1080/00224065.1986.11978984.
- Mundwiller, S. Statistical Process Control–A Pragmatic Approach. Taylor & Francis Group, Boca Raton (2018).
- Pojasek, R.B. Lean, six sigma, and the systems approach: Management Initiatives for Process Improvement. Environ Qual Manag 13 85-92 (2003) DOI:10.1002/tqem.10113.
- Pyzdek, T. The Six Sigma Handbook, McGraw-Hill, New York (2003).
- Aized, T. Total Quality Management and Six Sigma. InTech, Rijeka (2012) DOI:10.5772/2559.
- Economic Commission for Europe of the United Nations (UN/ECE). Regulation No 87: Uniform provisions concerning the approval of daytime running lamps for power-driven vehicles, from https://eur-lex.europa.eu/legal-content/EN/TXT/?uri=CELEX%3A42010X0630(03), accessed on 2024-01-23.
- VDA. VDA 5 Quality Management in the Automotive Industry-Capability of Measurement Processes. VDA, Qualitäts Management Center, Berlin (2011).
- Kerzner, H. Project Management Metrics, KPIs, and Dashboards: A Guide to Measuring and Monitoring Project Performance. Wiley, Hoboken (2011) DOI:10.1002/9781118086254.
- Neely, A. Business Performance Measurement. Cambridge University Press, Cambridge (2002) DOI:10.1017/CBO9780511753695.
- Zhou, J., Wang, Y., Chua, Y.Q. Real-Time OEE for Industry 4.0 Learning and Practice Training. Procedia CIRP 96 191-196 (2021) DOI:10.2139/ssrn.3864886.