


1 INTRODUCTION
The supersonic wind tunnel test section, as the core functional unit, directly determines the reliability of aerodynamic force measurements through its flow field quality. Among current mainstream test section configurations, open free-jet wind tunnels are widely adopted for their superior simulation of real aircraft flow characteristics, unobstructed optical measurement path, and convenient model installation. However, flow pulsations caused by unsteady shear layer evolution, with turbulence intensity reaching 3 to 5 times that of closed test section tunnels [1], have become a bottleneck limiting test accuracy [2]. Particularly under back-pressure mismatch conditions, the dynamic switching of the nozzle outlet jet between under-expanded and over-expanded states induces complex flow phenomena such as shock train oscillations and shear layer instability. This causes Mach number fluctuations in the core region to exceed 15 % of the design value [3], severely compromising the validity of aerodynamic test data.
Researchers have conducted multidimensional studies on supersonic wind tunnel flow field quality optimization, which can be divided into three main branches: back-pressure matching method, flow field structure control, and pressure pulsation suppression. Regarding flow field structure control, Rodríguez Lastra et al. [4] achieved a 22 % improvement in core region homogeneity through nozzle profile optimization, though they did not account for the impact of dynamic backpressure fluctuations on the optimized flow field. Kulkarni et al. [5] employed a honeycomb-mesh combination device to reduce turbulence intensity to 0.3 % in subsonic wind tunnels, while the adaptability of this method in supersonic flow with strong shock waves remains to be verified.
Regarding back-pressure matching, which is the core prerequisite for achieving high-quality flow fields in supersonic wind tunnels, Liu et al. [6] conducted numerical simulations based on the Reynolds-averaged Navier–Stokes (RANS) method to propose a rapid static pressure matching method for supersonic wind tunnel jets, and verified its effectiveness in improving the flow field uniformity of the supersonic jet through wind tunnel tests. However, this previous work only focused on the realization of ideal expansion and flow uniformity improvement, without any analysis of the pressure pulsation characteristics under different matching states. Feng et al. [7] found that elevating vacuum sphere backpressure induces shock wave progression speeds up to 12 m/s, increasing total pressure loss by 18 %. Experimental results by Xiong et al. [8] indicate that as backpressure levels increase, the oscillation frequency of separation shocks rises while the length of the intermittent zone decreases. Machine learning-assisted back pressure prediction methods [9] have been demonstrated to improve matching efficiency by 40 %, though their generalization capability under different Mach number conditions requires further validation. It should be noted that all existing back-pressure matching studies take flow field uniformity as the only optimization objective, and do not consider the impact of back-pressure matching state on the pressure pulsation characteristics in the test section.
Regarding pressure pulsation characteristics in supersonic flows, Sandham and Reynolds [10] revealed that vortex pairing within transonic mixed layers generates pressure pulsations peaking at St = 0.25. Tam’s classical broadband pressure pulsation model [11] indicates that shock train oscillations dominate energy distribution within the 200 Hz to 2000 Hz frequency band in supersonic jets. Bogey et al. [12] conducted numerical simulation of sound generated by vortex pairing in a mixing layer, revealing the correlation between large-scale vortex structures and low-frequency pressure pulsations. However, these studies mainly focus on free supersonic jets, and the pressure pulsation characteristics of confined jets in open supersonic wind tunnel test chambers, especially how the back-pressure matching state regulates the pulsation intensity and spectral characteristics, have not been systematically studied.
Recent work by Zhi et al. [13] demonstrates that inverse optimization based on adjoint equations can simultaneously improve flow field quality and pressure pulsation characteristics while reducing memory requirements by an order of magnitude, which provides a methodological reference for multi-objective optimization of wind tunnel flow fields. However, to date, no study has revealed the coupling mechanism and quantitative trade-off relationship between flow field uniformity and turbulent pressure pulsations in supersonic wind tunnel back-pressure matching. This leads to a long-standing engineering dilemma: the ideal expansion state obtained by traditional back-pressure matching achieves the best flow uniformity but may not be the optimal operating condition for pulsation-sensitive tests (such as flutter tests and precision acoustic measurements).
This study focuses on the hydrodynamic pressure pulsations generated within the flow field of a supersonic wind tunnel test section. In supersonic wind tunnel engineering, such near-field pressure disturbances significantly impact the accuracy of model aerodynamic force measurements and may induce structural flutter due to their strong interference effects, making them a critical indicator for evaluating flow field quality alongside uniformity. Existing research lacks a systematic analysis of how internal pressure pulsations within the test section are regulated by the backpressure matching state and has not established a quantitative relationship between the two core flow quality indicators. Therefore, investigating how backpressure influences the intensity and spectral characteristics of pressure pulsations by altering flow field structures-such as shock systems and shear layers-holds clear engineering significance for guiding wind tunnel testing and enhancing data reliability. Compared with existing research, the original contributions of this study are as follows:
1. First revelation of the trade-off mechanism between flow field uniformity and turbulent pressure pulsations: We found that the ideal expansion state with optimal uniformity corresponds to the strongest turbulent pressure pulsations, while moderate back-pressure mismatch can suppress pulsations at the cost of partial uniformity, filling the research gap that existing studies only optimize a single flow quality indicator in isolation.
2. Elucidation of the intrinsic physical mechanism of the trade-off effect: Through RANS-large eddy simulation (LES) multiscale simulation and Ffowcs Williams-Hawkings (FW-H) acoustic analogy analysis, we clarified that the core mechanism is the dual effect of shock waves: shock waves under mismatched backpressure destroy flow uniformity, but simultaneously suppress the full development of shear layer turbulence, thereby reducing the intensity of turbulent pressure pulsations.
3. Establishment of scenario-specific back-pressure selection strategies: Based on the trade-off mechanism, we propose differentiated back-pressure strategies for high-precision aerodynamic tests and low-disturbance pulsation-sensitive tests, which provide direct guidance for the actual operation of supersonic wind tunnels.
2 METHODS
2.1 Physical Model and Computational Domain
The research object of this study is an open free-jet supersonic wind tunnel test section, whose core structure is shown in Fig. 1. The main functional modules are as follows:
1. Converging-diverging Laval nozzle: The design Mach number at the nozzle outlet Ma0 = 2, and the hydraulic diameter of the nozzle outlet Dc = 2000 mm;
2. Test chamber: The axial length of the test chamber Lchamber = 6Dc, with a standard conical aerodynamic calibration model arranged inside, and the jet flow path length Lj = 6000 mm;
3. Bell-shaped collector: The expansion angle θ = 8°, with an optimized profile to suppress flow separation at the inlet [14];
4. Secondary expansion section: Designed to decelerate the jet outlet velocity to the subsonic range.
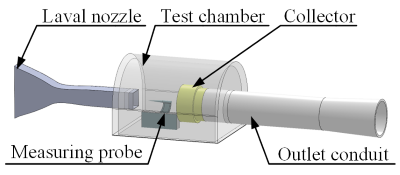
Fig. 1. Schematic diagram of wind tunnel model
The full axial length of the computational domain is 46.5 m, and the lateral range fully covers the jet core region and the developing shear layer to avoid domain boundary interference with the supersonic jet flow. The schematic diagram of the computational domain and boundary conditions is shown in Fig. 2.
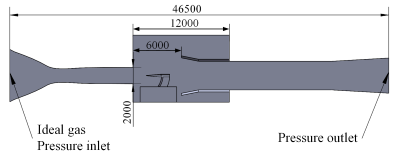
Fig. 2. Jet computational domain dimensions and boundary conditions (center section at nozzle outlet) in [mm]
2.2 Numerical Simulation Methods
Aiming at the three-dimensional compressible turbulent flow in the supersonic wind tunnel, this study adopts a multi-scale hybrid numerical strategy combining RANS steady-state simulation and LES transient simulation.
2.2.1 Core Governing Equations
The basic governing equation of this study is the three-dimensional compressible RANS equations, including the continuity equation, momentum equation and energy equation, which fully describe the conservation laws of mass, momentum and energy for compressible turbulent flow. The fluid medium is set as ideal gas (air), with a specific heat ratio γ = 1.4 and a specific gas constant R = 287 J/(kgK). The dynamic viscosity of the fluid is calculated by the Sutherland formula.
2.2.2 Turbulence Models
(1) SST k−ω turbulence model (RANS steady-state simulation)
RANS steady-state simulation is used to quickly obtain the flow field structure and core flow parameters under different back-pressure conditions and complete the rapid solution of back-pressure matching. The SST k−ω model is selected, which combines the advantages of the k−ω model in the near-wall region and the k−ε model in the mainstream region. It can effectively suppress the excessive diffusion of free shear flow [15] and is especially suitable for the simulation of shock wave/boundary layer interaction in supersonic flow, which is highly consistent with the flow characteristics of this study.
The inlet boundary conditions of the model are set according to the wind tunnel measured turbulence intensity Tu = 1 % [16], and the mixing length is taken as 5 % of the hydraulic diameter Dc of the nozzle outlet, to calculate the inlet values of turbulent kinetic energy k and specific dissipation rate ω.
(2) WALE subgrid-scale model
LES transient simulation is used to analyze the unsteady evolution of the shear layer, vortex shedding and large-scale vortex structures, and reveal the generation mechanism of pressure pulsations. The wall-adapting local eddy-viscosity (WALE) subgrid-scale model is selected, which can accurately capture the wall turbulence characteristics and avoid the over-dissipation problem of the traditional Smagorinsky model in the near-wall region [17]. It is more suitable for the coupled flow simulation of wall boundary layer and free shear layer in this study.
The time step of LES simulation is set to Δt = 8×10⁻⁶ s to ensure the global Courant-Friedrichs-Lewy number CFL < 1, which meets the stability requirements of transient simulation. The sampling frequency of the pressure pulsation signal is set to 20 kHz, which meets the Nyquist sampling criterion for the highest concerned frequency of 8 kHz.
2.2.3 Pressure Pulsation Analysis Method
To thoroughly analyze the generation and evolution mechanisms of such disturbances and to quantify and compare their intensity, the FW-H acoustic analogy equation is adopted as the core analytical framework. It should be clarified that the application here is not intended to predict far-field acoustic noise. Instead, it leverages the theoretical advantage of this equation to decompose, identify, and track the contributions of primary pulsation sources within the computational domain in both the time and frequency domains. For instance, the quadrupole term (Tij) can be used to analyze the contribution of turbulent mixing to pressure pulsations, while the dipole term (Pij) can be employed to evaluate the impact of solid wall interactions.
Building upon Curle’s work, Ffowcs Williams and Hawkings employed a generalized function approach to derive the FW-H equation for separating flow-induced noise source mechanisms [18]:
\tag{3}
\begin{aligned}
\frac{1}{c_0^2}\frac{\partial^2 p’}{\partial t^2}
-\nabla^2 p’
&=
\frac{\partial^2}{\partial x_i \partial x_j}
\left\{
T_{ij} H(f)
\right\}
\\[0.5em]
&\quad
-\frac{\partial}{\partial x_i}
\left\{
\left[
P_{ij} n_j
+
\rho u_i (u_n – v_n)
\right]
\delta(f)
\right\}
\\[0.5em]
&\quad
+\frac{\partial}{\partial t}
\left\{
\left[
\rho_0 v_n
+
\rho (u_n – v_n)
\right]
\delta(f)
\right\}.
\end{aligned}
\end{equation}$$
In Equation (3), c0 is the speed of sound, p pressure, t time, ρ density, Tij the Lighthill stress tensor, H(f) the Heaviside function, δ(f) the Kronecker delta function, ui the fluid velocity component in the xi direction, un the normal fluid velocity component on the integration surface, vi the interfacial velocity component in the xi direction, and vn the normal interfacial velocity component.
2.2.4 Numerical Discretization Scheme
To ensure the capture accuracy of supersonic shock waves, the Coupled solver algorithm is used to solve the momentum equation and energy equation simultaneously, to avoid shock oscillation caused by pressure-velocity decoupling [19]. The discretization schemes are set as follows:
1. Gradient term: Green-Gauss node-based method, which is suitable for high-precision solution of unstructured meshes;
2. Viscous term: second-order central difference scheme;
3. Convective term: third-order accuracy Quadratic Upstream Interpolation for Convective Kinetics (QUICK) scheme, to suppress excessive dissipation of shock waves by the first-order scheme [20].
2.3 Boundary Condition Settings
To accurately replicate the real working state of the supersonic wind tunnel and ensure the accuracy of flow field simulation and pressure pulsation calculation, the boundary conditions were set as follows:
1. Inlet Boundary: The inlet of the Laval nozzle is set as the pressure inlet boundary, with inlet total pressure P0 = 260 kPa, total temperature T0 = 293 K, and turbulence intensity Tu = 1 %;
2. Outlet Boundary: The outlet of the secondary expansion section is set as the pressure outlet boundary, and the standard characteristic non-reflective boundary condition based on the Poinsot-Lelef theory is adopted. This method decomposes the flow variables at the boundary into Riemann invariants propagating along different characteristic directions, accurately distinguishes outgoing physical waves and incoming non-physical reflected waves, and completely absorbs the non-physical reflected waves generated at the truncated boundary [21]. It can effectively eliminate the contamination of the upstream flow field and pressure pulsation results caused by pressure wave reflections. The outlet static pressure Pout is the control variable of back-pressure matching, and the initial value is set to the theoretical isentropic static pressure of 85 kPa;
3. Wall Boundary: All solid wall surfaces are set as adiabatic no-slip boundary conditions [22], and the boundary layer mesh is refined to ensure the dimensionless wall distance y+ < 1, which meets the near-wall resolution requirements of the turbulence model.
2.4 Mesh Generation and Independence Verification
2.4.1 Mesh Generation Strategy
The computational domain is discretized by a hybrid mesh of hexahedral and polyhedral elements, which balances computational efficiency and adaptability to complex geometries. The core refinement strategies are as follows:
1. Global refinement of the Laval nozzle flow domain and the jet core region from the nozzle outlet to the collector inlet, to accurately capture the shock wave structure and shear layer evolution;
2. Local refinement of the test model wall surface, to capture flow separation and shock wave/boundary layer interaction;
3. Boundary layer refinement is set for all solid wall surfaces, with the first layer mesh height of 0.01 mm to ensure y+ < 1.
The details of mesh generation are shown in Fig. 3.
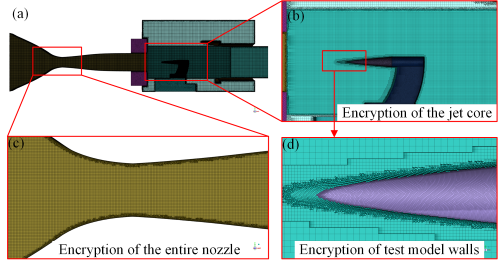
Fig. 3. Details of computational domain mesh generation; a) nozzle and test chamber; b) jet core region; c) nozzle flow domain; d) wall refinement on test model surfaces
2.4.2 Mesh Independence Verification
Mesh independence verification is carried out in strict accordance with the ASME V&V 20-2009 standard [23]. Three sets of meshes with different densities are designed: coarse mesh (16 million elements), mid mesh (18 million elements), and fine mesh (20 million elements), with the minimum mesh sizes of 6 mm, 5 mm and 4 mm, respectively. The mesh quality comparison is shown in Table 1.
Table 1. Mesh quality inspection results
| Mesh level | Minimum orthogonal mass | Maximum aspect ratio | Volume change rate |
|---|---|---|---|
| Coarse | 0.151 | 35 | 1.8 |
| Mid | 0.144 | 28 | 1.5 |
| Fine | 0.128 | 22 | 1.3 |
Sixteen monitoring points (P1-P8 for the jet axis and P9-P16 for the shear layer) were positioned (Fig. 4), distributed uniformly along the axial direction from the nozzle outlet cross-section to the model tip. This study uses the center point of the nozzle outlet cross-section as the coordinate origin (0, 0, 0). Monitoring point P1 is located at the coordinate origin, while monitoring point P8 is positioned at the tip of the test model.
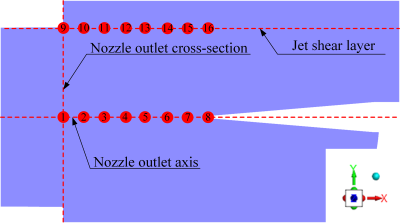
Fig. 4. Schematic diagram of monitoring points in the center cross-section of the test chamber
Three sets of meshes underwent RANS steady-state flow field numerical simulations with identical computational parameters. The outlet pressure Pout in the wind tunnel was set to 85 kPa. The convergence criterion for all RANS steady-state simulations in this study adopts a dual judgment method to ensure numerical reliability, especially considering the strong unsteady characteristics of the confined jet flow field in the closed test chamber: (1) The residual errors of all governing equations are reduced to the order of 10−6; (2) The Mach number fluctuations at all monitoring points remain below 0.2 % for 1000 consecutive iteration steps.
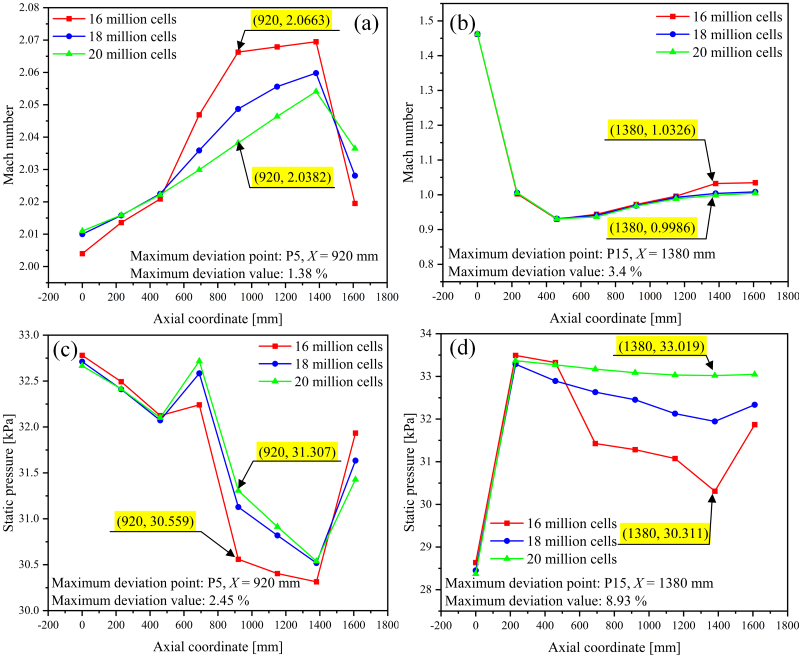
Fig. 5. Mesh independence verification results (Pout = 85 kPa); a) Mach number at axis monitoring points; b) Mach number at shear layer monitoring points; c) static pressure at axis monitoring points; d) static pressure at shear layer monitoring points
Figure 5 presents the flow field parameter deviation analysis of the numerical simulation results. The results from all three meshes are reasonable, with the Mach number at the monitoring points consistent with the static pressure distribution. The maximum deviation in Mach number at the axial monitoring points was 1.38 % (at P5, x = 920 mm); The maximum deviation in the Mach number of the shear layer occurred at monitoring point P15 (x = 1380 mm), with an error of 3.4 %, satisfying the requirement for mesh independence. Grid convergence index (GCI) [24] evaluation:
=
\frac{1.25\left|\varepsilon\right|}
{r^p-1}
=
2.7\%
<
5\%.
\tag{4}$$
Variable r = 1.25, and represents the mesh refinement factor, p = 1.85 denotes the accuracy order, and ε is the error tolerance. To capture greater flow detail within the supersonic jet field, a fine mesh (20 million elements) was ultimately selected for subsequent simulations. To meet the strict requirement of y+ < 1 for near-wall turbulence models, the fine mesh adopts more refined boundary layer refinement on all solid walls (first layer mesh height of 0.01 mm). In complex geometric regions with large curvature changes, such as the nozzle outlet corners and the collector inlet lip, the orthogonality of local meshes will inevitably decrease slightly to ensure a reasonable aspect ratio of the boundary layer meshes. However, the minimum orthogonal qualities of all three sets of meshes are greater than 0.12, which is much higher than the general qualified threshold of 0.1 for computational fluid dynamics calculations. Moreover, the mesh independence verification has proven that the discretization error is within the acceptable range. Therefore, it will not have a negative impact on the accuracy of the calculation results or the stability of the LES transient calculations.
3 RESULTS
3.1 Innovative Pathways for Rapid Matching Methods
During wind tunnel tests with mismatched back pressure, phenomena such as alternating expansion and compression waves, along with shock interference, occur at the center of under/over-expanded jets. The back pressure matching strategy is employed to maintain the supersonic jet in an ideal expansion state within the test chamber, thereby establishing a uniform flow field within the jet boundary. This technique precisely adjusts the chamber’s back pressure, enabling the uniform flow region to transcend the limitations of traditional diamond shock structures. This method systematically determines optimized operating parameters (particularly the matched static pressure) to minimize flow distortions caused by shock waves.
Traditional backpressure matching relies on trial-and-error adjustments between inlet total pressure Pin and outlet static pressure Pout to approximate ideal expansion. This approach suffers from two major bottlenecks: (1) Inefficiency: Referencing T-325 wind tunnel data [25], the entire matching process requires dozens of iterations; (2) Limited accuracy: Reliance on empirical thresholds makes it difficult to capture critical pressure gradients, such as the sudden increase in total pressure loss when shock train advance rates exceed 8 m/s [26].
This study proposes a rapid backpressure matching framework based on RANS response surface optimization (Fig. 6). The method uses outlet static pressure Pout as the control variable, with an initial value set to the theoretical isentropic value Pisentropic = 85 kPa [27]. The Pout step size is adjusted based on gradient sensitivity, starting at 10 kPa and decreasing to 2 kPa during the convergence phase.
To monitor the jet configuration throughout the core region of the test chamber, maximize the uniform jet zone, and enhance the accuracy of back-pressure matching results, the back-pressure matching study will focus on the flow field of the supersonic wind tunnel test section without a test model. Nine Mach number monitoring points M1-M9 are positioned along the jet axis (Fig. 7), covering the entire flow path from the nozzle outlet to the collector inlet (axial spacing: 1000 mm). After the RANS steady-state calculation has fully reached the numerical convergence state, we further judge whether the back-pressure matching goal is achieved. Iteration ceases when the Mach number at all 9 axial monitoring points (M1-M9) satisfies | Ma – Ma0 | / Ma0 < 5 % (Ma0 = 2), serving as the engineering convergence criterion for back-pressure matching. This ultimately yields an outlet static pressure Pm = 82 kPa that satisfies the ideal expansion condition.
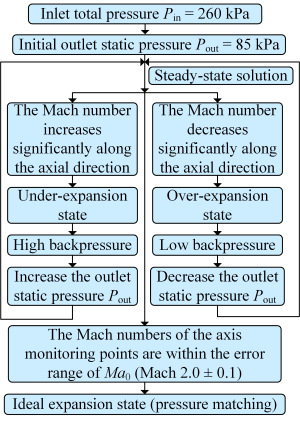
Fig. 6. Flowchart of the rapid RANS-based back-pressure matching method
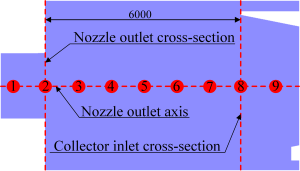
Fig. 7. Schematic of axial Mach number monitoring points for back-pressure matching
3.2 Matching Result Verification Analysis
Figure 8 shows a comparison of Mach number contour plots for three typical operating conditions (Pout = 75/90 kPa and Pm = 82 kPa) to validate the matching results. The Mach number distribution at each monitoring point is depicted in Fig. 8d. Figure 8b depicts the supersonic jet flow field under ideal expansion conditions (Pm = 82 kPa), where gas flows uniformly and steadily into the test chamber from the nozzle outlet. The flow field in the core region exhibits no significant expansion acceleration or compression deceleration processes. Compared to the under/over-expansion backpressure mismatch conditions, the ideal expansion jet field exhibits no shock interference, resulting in a more uniform velocity distribution with a maximum deviation of 3.4 % (at point M8). This meets the engineering tolerance of Ma0 ± 5 % (Fig. 8d) and features a longer core region within the test chamber. Simultaneously, as shown in Fig. 8b, the shear layer within the ideal expansion jet field is more stable and fully developed throughout the test range. The shear layer half-angle θshear = 2.1° exhibits no significant vortex shedding, verifying the steady-state nature of the flow field without model interference.
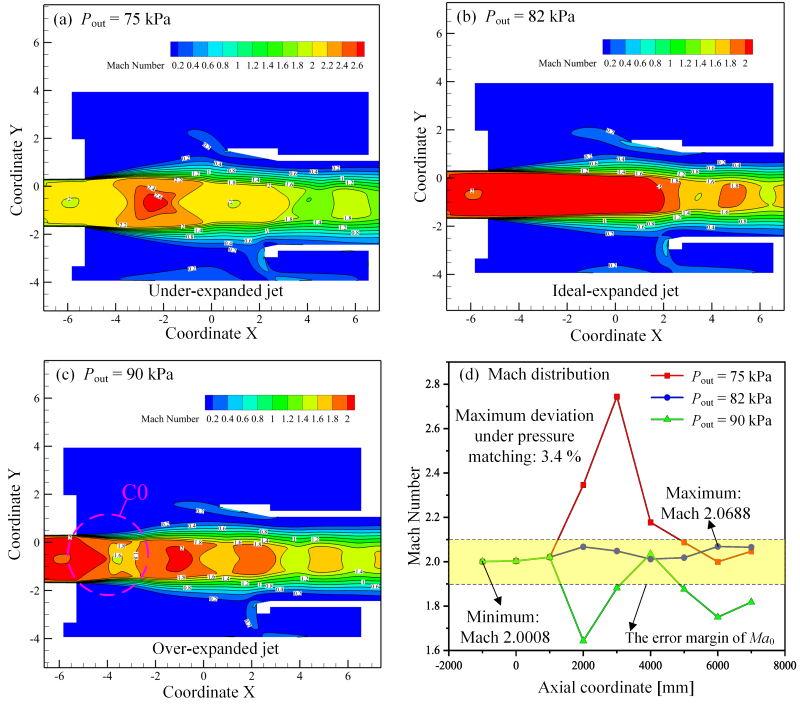
Fig. 8. Back-pressure matching results: Mach number contours and axial distribution under typical conditions
Figure 8a depicts the supersonic jet flow field under under-expanded conditions (Pout = 75 kPa). Upon entering the test chamber, the jet expands and accelerates, inducing an expansion wave train (wavelength λexp = 4.2De) and periodic compression zones. The Mach number along the jet centerline reaches a maximum of Mach 2.6 (at point M5). Simultaneously, the shear layer of the under-expanded jet expands outward away from the horizontal plane, with its outward expansion angle increasing to 6.7°. This layer entrainment forms large-scale vortex structures (diameter Dv ≈ 0.3De) from the low-speed fluid within the test chamber, inducing intense pressure pulsations in the jet core region. Figure 8c depicts the supersonic jet field under over-expansion conditions (Pout = 90 kPa). After entering the test chamber, the jet undergoes compression and deceleration, resulting in a core Mach number significantly lower than Ma0. The shear layer develops inward away from the horizontal line, exhibiting shock train oscillations in the C0 region. This generates a Mach disk downstream of the nozzle (position x = 1.2De) and a pair of oblique shocks, resulting in total pressure loss for the jet. Since the total pressure loss behind the Mach disk exceeds that behind the oblique shock, the jet’s centerline reverse pressure gradient triggers a recirculation zone (length Lrecirculation = 2.8De). The oblique shock reflects off the shear layer, causing the over-expanded jet to undergo alternating expansion acceleration and compression deceleration. This induces strong pressure pulsations in the central flow field, degrading the flow quality for wind tunnel testing.
Achieving ideal expansion fundamentally requires the coordinated regulation of static pressure equilibrium and momentum conservation. When Pout = Pm = 82 kPa, the static pressure of the nozzle-outlet jet balances the ambient pressure, suppressing the generation of expansion/compression wave trains. At this point, the momentum thickness growth rate dδθ/dx at the nozzle outlet approaches zero, and the flow field enters a quasi-steady state.
4 DISCUSSION
4.1 Analysis of Flow Structure and Pressure Pulsation Characteristics
This section systematically analyzes the pressure pulsation characteristics under different back-pressure matching conditions, focusing on revealing the core physical mechanism of the trade-off between flow field uniformity and pressure pulsation intensity. To quantify and compare the intensity of pressure fluctuations induced by turbulent shear layers, shock oscillations, and vortex evolution, sound pressure level (SPL) is adopted as the dimensionless metric. We first compare the overall SPL distribution in the test chamber, then analyze the spectral characteristics of pressure pulsations at representative positions and finally elucidate the generation mechanism of the trade-off effect through unsteady flow field analysis.
4.1.1 Comparative Analysis of Flow Field Structures in the Core Region
A comprehensive study was conducted on the flow parameter characteristics and sound pressure level distribution patterns in the core region under three typical operating conditions (Pout = 75/90 kPa and Pm = 82 kPa). Figure 9 shows the Mach number contour plots within the center plane of the test chamber for each operating condition, while Fig. 10 illustrates the sound pressure level distribution at representative locations within the jet field. Pressure pulsation monitoring points P17~P30 were positioned along the shear layer and jet centerline (Fig. 10a), with adjacent monitoring points on the shear layer spaced 1000 mm axially apart.
(1) Ideal expanded jet (Pm = 82 kPa): As shown in Fig. 9b, the Mach number distribution in the jet core region is uniform, with a standard deviation σMa = 0.06, satisfying the Ma0 ± 5 % flow field quality requirement. This indicates stable flow in the core region without flow separation. The uniform region extends 15 % further than in an over-expanded jet and 12 % further than in an under-expanded jet. As shown in Fig. 10b, when the jet does not collide with the test model, the pressure pulsations along the jet centerline (P26, P1, P27) and the shear layer (P17~19) remain relatively stable. This is because within this region, the ideal expanded jet core exhibits no significant pressure gradient and relatively low turbulence. Based on Bernoulli’s equation, the jet flow through the conical model causes changes in the test chamber cross-section. Pressure variations at both ends of the cross-section induce wall-following vortices, generating turbulent boundary layer pressure pulsations. The sound pressure level within the shear layer continuously increases (P19~P23), reaching its maximum value (P24) at the collector inlet cross-section.
A weak shock wave formed as the jet impinged on the model tip, generating a small-scale detached shock wave in region B1 (intensity ΔMa = 0.4). The total pressure loss of only 2.3 % aligns with the small disturbance theory [27]. After passing through the test model, the jet’s cross-sectional area changes and the influence of the separated vortex in region B4 induces a shock wave at the model wall surface in region B2, reducing the Mach number of the trailing fluid. The separated vortex structure generated by the jet passing through the test model causes a sharp increase in turbulence intensity within region B4, producing high pressure pulsations that cause the sound pressure level at monitoring point P28 to reach its peak. Multiscale spatial vortex structures within the test chamber continuously interacted through interference, collision, and coalescence. This induced a strong shock train in the B3 region, located slightly behind the core region. After accelerating to Mach 2.4 at the collector inlet, the oblique shock wave caused total pressure loss in the core jet. Consequently, the sound pressure levels at the fluid centerline (P29, P30) and the shear layer (P25) decreased upon entering the collector.
(2) Under-expanded jet (Pout = 75 kPa): As shown in Fig. 9a, a series of shock waves and expansion wave trains appear within the test chamber. Upon entering the chamber, the unstable jet boundary generates pressure pulsations, increasing the sound pressure level at shear layer monitoring points (P17~19). Expansion wave trains propagating along the pressure gradient induce shear layer instability, triggering a transition when Reθ > 5000 [28]. Sound pressure levels at midline monitoring points P26, P1, and P27 decreased. This resulted from the partially expanded jet expanding outward within the test chamber, consuming kinetic energy and reducing turbulent mixing intensity in the jet core region. The expansion wave at the nozzle outlet has a wavelength λexp = 2.2De, with a wave velocity exceeding the flow velocity in the jet core. The expansion wave system gradually evolves within the test chamber, inducing periodic compression zones in regions A2 and A3. This results in a significantly lower sound pressure level (P20~24) in the jet shear layer during this phase compared to the ideal/ over-expanded jet. Due to the expansion wave system’s dissipation of total jet pressure, a further reduction in sound pressure level (P20) occurs. As the jet passes through region A1, a positive shock forms at the model’s leading edge, causing the local Mach number to abruptly drop from Mach 2.2 to Mach 1.6. This results in a substantial decrease in the total pressure of the core jet.
(3) Over-expanded jet (Pout = 90 kPa): As shown in Fig. 9c, after entering the test chamber, the jet induces shock oscillations within the shear layer due to the reverse pressure gradient, leading to fluid separation and a gradual increase in sound pressure level (monitoring points P17~19 in the shear layer, and P26, P1, P27 on the centerline). Within region C1, the nozzle edge excites two oblique shock waves (angle β = 33°), generating a Mach disk structure at x = 1.2De and inducing a recirculation zone in the core jet, characterized by alternating expansion acceleration and compression deceleration cycles. As shown in region C3, the expansion wave formed by the reflection of oblique shock waves increases the local fluid Mach number from Mach 1.8 to Mach 2.4, validating the shock-expansion wave alternation theory [29]. During this phase, complex shock structures exist at the jet boundary, generating intense pressure pulsations that cause a sustained increase in shear layer sound pressure level (P20~P24).
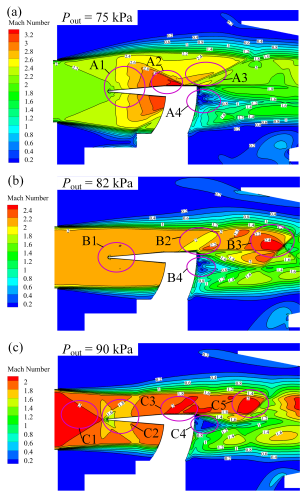
Fig. 9. Mach number contours of typical jet configurations;a) under-expanded; b) ideal-expanded; c) over-expanded
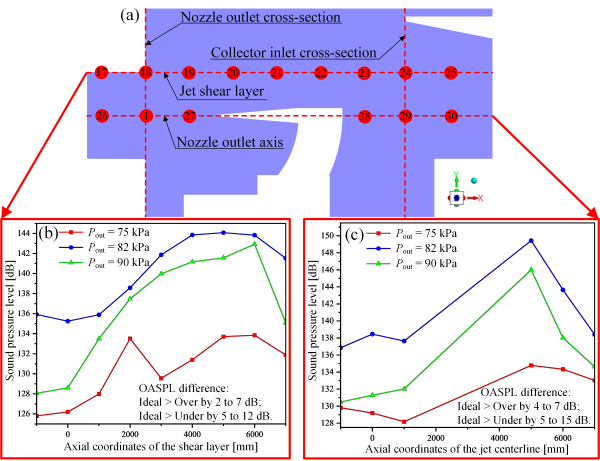
Fig. 10. Sound pressure level distribution in the jet field; a) monitoring points; and sound pressure at b) P17-P25, c) P26-P30
Under ideal expansion conditions, pressure pulsations at monitoring points within the test chamber jet field were higher, exceeding those under under-expansion conditions by 5 dB to 15 dB and those under over-expansion conditions by 2 dB to 7 dB. The ideal expansion jet field exhibits reduced wave interference phenomena, allowing full development of the core fluid and shear layer. This creates a significant velocity gradient between the shear layer and the stationary air, triggering intense turbulent mixing and vortex motion, which induces strong unsteady turbulent pulsations. Simultaneously, based on Lighthill acoustic analogy theory analysis, the quadrupole acoustic source (turbulent pressure pulsation) induced by the jet shear layer turbulence is proportional to the eighth power of the jet velocity (I∝U8). Therefore, the higher the jet velocity within the test chamber, the greater the pressure pulsation radiation efficiency. After leaving the nozzle, under-expanded jets consume kinetic energy through shock-induced compression or expansion processes, weakening shear layer turbulence mixing intensity compared to ideal expansion states. Over-expanded jets form complex shock structures at their boundaries, diverting energy toward structural adaptation to ambient pressure, thereby reducing energy available for intense turbulence mixing. Both phenomena cause the actual velocity of the jet in the core region to be lower than that in the ideal expansion state, thereby reducing the turbulent pressure pulsation radiation efficiency.
4.1.2 Analysis of Pressure Pulsation Spectrum Characteristics
The pressure pulsations in the jet flow field primarily consist of turbulent mixing pressure pulsations and broadband shock pressure pulsations. Turbulent mixing pulsations mainly originate from disturbances in the shear layer and are related to the turbulent patterns within the jet. Broadband shock pulsations result from the interaction between unstable waves and shock crystal cell structures. To precisely reveal the core pressure pulsation mechanism and present results more selectively, we analyzed the spectral characteristics of the most representative monitoring points: P20 and P25 for the shear layer, and P28 and P29 for the jet centerline (Figs. 11 and 12).
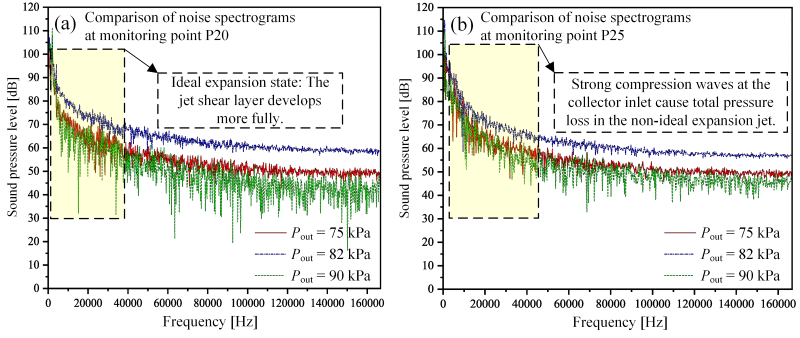
Fig. 11. Pressure pulsation spectra at representative shear layer monitoring points under different back-pressure conditions; a) P20 (upstream shear layer, in front of the test model); b) P25 (downstream shear layer, at the collector inlet)
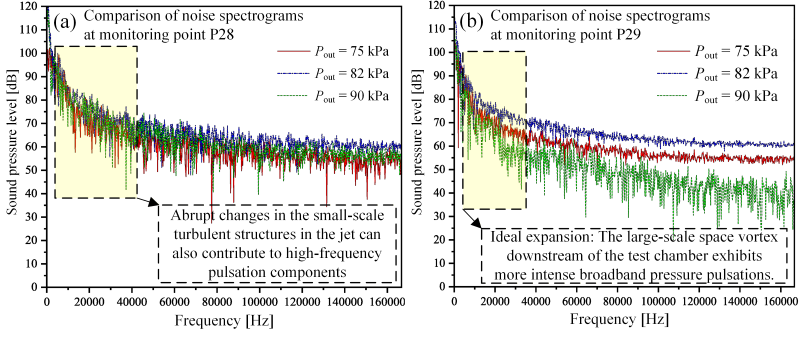
Fig. 12. Pressure pulsation spectra at the peak sound pressure level region on the jet centerline under different back-pressure conditions; a) P28 (at the tail of the test model); b) P29 (downstream core region of the model)
The spectral analysis shows that all pressure pulsations in the test chamber exhibit typical broadband characteristics, which are mainly dominated by turbulent mixing-induced quadrupole sources. However, significant differences exist in the spectral energy distribution under different back-pressure matching states, which directly correspond to the trade-off mechanism between flow uniformity and pressure pulsation intensity.
For the shear layer monitoring points (Fig. 11), at P20 (upstream shear layer, in front of the test model), the ideal expansion state (Pm = 82 kPa) shows significantly higher sound pressure levels in the entire frequency range compared to the under-expanded (Pout = 75 kPa) and over-expanded (Pout = 90 kPa) states. This is because the absence of shock interference allows the jet shear layer to develop more fully, resulting in stronger turbulent mixing and more intense low-frequency broadband pulsations (0 Hz to 40,000 Hz), as marked in Fig. 11a. At P25 (downstream shear layer, at the collector inlet), the sound pressure level difference between the three states decreases. Notably, the under-expanded and over-expanded jets exhibit more prominent high-frequency pulsation components above 40000 Hz. This is caused by strong compression waves generated at the collector inlet when the non-ideal expansion jet impinges on the collector lip, which leads to additional total pressure loss and high-frequency pressure disturbances, as marked in Fig. 11b.
For the centerline monitoring points in the peak sound pressure level region (Fig. 12), at P28 (at the tail of the test model), all three states show high sound pressure levels in the low-frequency range (0 Hz to 40000 Hz). The ideal expansion state still has the highest overall energy, while the under-expanded and over-expanded states exhibit more obvious high-frequency fluctuations. These high-frequency components are caused by abrupt changes in small-scale turbulent structures when the jet passes through the test model and interacts with the separated flow at the model tail, as marked in Fig. 12a. At P29 (downstream core region of the model), the ideal expansion state shows the most intense broadband pressure pulsations across the entire frequency range. This is because large-scale spatial vortices generated downstream of the test chamber develop most fully under ideal expansion conditions, without being disrupted by shock waves. In contrast, the periodic shock structures in under-expanded and over-expanded jets break the coherence of large-scale vortices, reducing the overall turbulent mixing intensity and pressure pulsation energy, as marked in Fig. 12b.
These spectral results directly confirm our core finding: the ideal expansion state with the best flow uniformity corresponds to the strongest turbulent pressure pulsations, while moderate back-pressure mismatch can suppress low-frequency broadband pulsations at the cost of introducing some high-frequency shock-induced disturbances.
In summary, large-scale quasi-ordered vortices within the shear layer serve as the primary source inducing turbulent mixing pressure pulsations, propagating low-frequency pressure pulsations downstream. The ideal expansion jet exhibits higher turbulent mixing intensity, leading to a dominant low-frequency energy contribution from turbulent mixing pressure pulsations that govern the flow field’s pulsation characteristics. Under/over-expanded jets also exhibit high-frequency pressure pulsations radiating over a wide-angle range within the shear layer as expansion waves or shock waves, alongside high-frequency shock pressure pulsations generated by periodic oscillations of shock cells. Integrating Tam’s broadband pressure pulsation theory, broadband shock pulsations exhibit monopole or dipole characteristics. Consequently, jet energy concentrates in the high-frequency range with lower propagation efficiency, resulting in a smaller energy contribution compared to turbulent mixing pressure pulsations. This study thus reveals the direct correlation between the frequency-domain distribution differences of pressure pulsation energy under varying backpressure conditions and the flow field structure.
4.2 Evolution of Shock Waves and Shear Layers
Interference phenomena in the core region caused by random oscillations of the shear layer due to mutual interference between multi-scale spatial vortex structures and back-pressure mismatch both lead to strong pressure pulsations in the central flow field. Based on LES models, unsteady numerical simulations of the jet flow field in the test chamber under different expansion states were conducted to analyze the mechanism behind the phenomenon where “the ideal expansion jet flow field exhibits stronger pressure pulsations”, providing technical support for improving the quality of the test chamber flow field.
(1) Ideal expanded jet (Pm = 82 kPa): The ideal expansion jet flows uniformly and steadily into the D1 region (Fig. 13) without shock disturbance. Due to the changing cross-section of the test chamber, small-scale wall-induced vortices exist in the D2 and D3 regions. The shear layer of the ideal expansion jet fully develops, exhibiting intense turbulent mixing. Within region D4, the shear layer entrainment of low-velocity fluid generates large-scale spatial vortex structures with pronounced vortex shedding. Region D5 represents a background flow, located on the leeward side of the test model. Here, a fully turbulent separated flow exists, with a lower Mach number within the separation zone due to model obstruction. The boundary of the supersonic jet contacts the spatial corners of the test chamber in regions D6 and D8, forming separation vortices before the collector inlet. Upon entering the collector, the jet encounters a sharp convex corner at the inlet edge. The flow wraps around this edge and expands outward, generating an expansion wave system. This expansion wave reduces flow pressure and significantly increases the Mach number, creating a localized high-Mach-number region within D7.
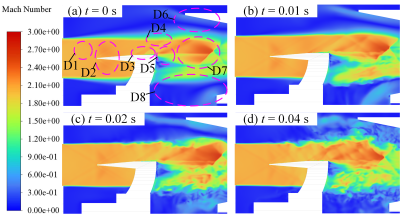
Fig. 13. Evolution of the unsteady flow field under ideal expansion conditions (Pm = 82 kPa) at representative time steps t: a) 0 s, b) 0.01 s, c) 0.02 s and d) 0.04 s
The nozzle jet pressure perfectly matches the ambient pressure, eliminating shock structures. Pressure pulsations in the jet field primarily originate from turbulent mixing within the high-speed shear layer. Without shock interference, the jet velocity distribution becomes more uniform, allowing more extensive turbulent development within the shear layer and higher turbulent pulsation intensity. Consequently, the quadrupole source term is significantly enhanced. Combined with the velocity-dominated effect from Lighthill theory, the pressure pulsation intensity of the jet in the ideal expansion state is higher. Simultaneously, the jet core region in the ideal expansion state is longer, and the spatial extent of the downstream turbulent mixing zone (the primary region for pressure pulsation generation) is larger. This allows more turbulent structures to participate in pressure pulsation propagation, making the integral effect of pressure pulsations in the far field more pronounced.
(2) Under/Over-expanded jet (Pout = 75/90 kPa): Fig. 14 shows the jet field evolution in the test chamber under under-expansion conditions. The under-expanded supersonic jet exhibits a complex shock-expansion wave coupled structure during free expansion. At the nozzle outlet region E1, an expansion wave is generated at the jet boundary induced by the pressure gradient and propagates toward the jet axis. Within region E2, the unstable core jet collides with the model’s leading edge, forming a reflected shock train at the model’s front. Symmetrical expansion wave convergence causes the axial static pressure to fall significantly below ambient pressure, generating an annular oblique shock within region E3. The jet shear layer in region E4, driven by viscous effects, entrain surrounding fluid to form large-scale coherent vortex structures. This facilitates the establishment of a stable expansion wave system through multiple reflections of the oblique shock. When under-expansion is pronounced, shear layer disturbances evolve into large-scale turbulent structures via vortex-shock interactions, inducing strong pressure pulsations and disrupting flow uniformity. Flow separation occurs at the model support step (E5), generating a front-step vortex structure. Within region E7, the interaction between the shock wave system and the recirculation zone weakens the jet shear effect, ultimately causing the oblique shock wave to gradually decay and disappear during its downstream propagation.
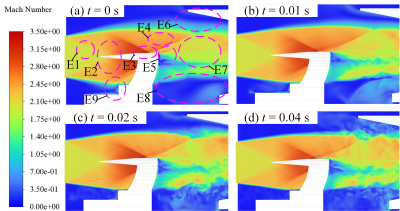
Fig. 14. Evolution of the unsteady flow field under under-expansion conditions (Pout = 75 kPa) at representative time steps t: a) 0 s, b) 0.01 s, c) 0.02 s and d) 0.04 s
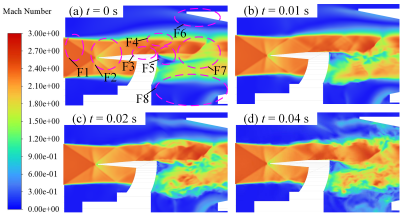
Fig. 15. Evolution of the unsteady flow field under over-expansion conditions (Pout = 90 kPa)
at representative time steps t: a) 0 s, b) 0.01 s, c) 0.02 s and d) 0.04 s
Figure 15 shows the evolution of the jet field in the test chamber under super-expansion conditions. Due to the ambient pressure exceeding the jet pressure at the nozzle outlet, a strong oblique shock structure forms in region F1. The induced shear layer contracts toward the axis, generating an oblique compression wave system that leads to the formation of a positive Mach disk at the tip of the test model in region F2. The jet excites multiple expansion waves along the model wall, causing the velocity vector in the core region to expand outward and form a diamond-shaped shock wave system (λ-type shock structure). As the positive shock propagates downstream, the diamond-shaped shock oscillates upstream. This process reduces the velocity gradient behind the shock, thereby shrinking the recirculation zone. As shown in region F3, when the diamond shock reaches the shear layer, the jet reflects a compression wave inward, converging into a second positive shock in region F3. As the shear layer destabilizes in region F4, increased turbulence distorts the oblique shock angle, affecting the shock structure’s orientation within the recirculation zone. Downstream in region F7, the shear layer evolves into a quasi-ordered large-eddy structure, which fragments into small-scale turbulent vortices. In region F8, vortices separated from the shear layer at the collector inlet generate upward-propagating compression waves. The jet exhibits dynamic coupling characteristics of shock wave reconstruction and turbulent transport.
The periodic formation and collapse of shock cell structures (rhombic shock chains) induce flow instabilities. The shear layer is cyclically compressed or stretched by the shocks, disrupting turbulent coherence and reducing the turbulence mixing intensity within the shear layer. At this point, the jet field exhibits a mixture of shock-related pressure pulsations (monopole or dipole sources) and turbulent pressure pulsations. However, the presence of the shock may suppress the generation of some shear layer pressure pulsations. Simultaneously, the shock system operating under back-pressure mismatch shortens the core region length, causing the turbulent mixing zone to enter a fully developed state earlier. However, the reduced range of pressure pulsation propagation may diminish the overall contribution of turbulent mixing pressure pulsations, resulting in the pulsation intensity being interfered with and weakened.
4.3 Comparative Analysis of Turbulent Kinetic Energy Distribution
The jet shear layer exhibits complex flow patterns and high turbulence intensity, serving as the primary source of jet pressure pulsations within the test chamber. Figure 16 displays turbulent kinetic energy contour plots for different jet configurations.
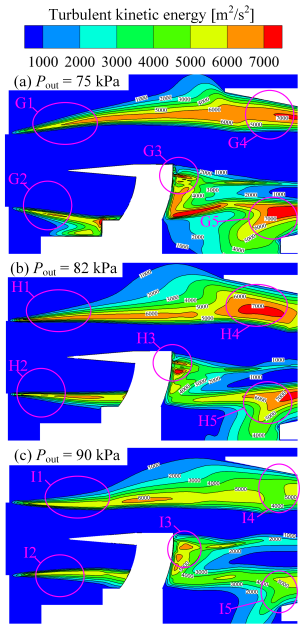
Fig. 16. Turbulent kinetic energy distribution of typical jets; a) under-expanded jet (Pout = 75 kPa); b) ideal expanded jet (Pm = 82 kPa); c) over-expanded jet (Pout = 90 kPa)
Consistent with the flow field structural characteristics described earlier, the high-turbulence intensity zones in the supersonic jet flow field are located within regions where spatial vortex structures develop. These include separation vortex structures at spatial corners like region H3; and large-scale spatial vortex structures induced by shock waves in the jet shear layer, forming low-velocity fluid regions in areas H4 and H5. In the ideal expanding jet regions H1 and H2, the shear layer develops stably along the axial direction (half-angle θshear = 2.1°). However, due to minimal interference from shock trains within the jet field, the ideal expanding jet develops more fully, exhibiting a longer turbulent shear layer and greater turbulence intensity in the core region (peak turbulent kinetic energy kmax = 7725 m²/s²). In the under-expanded jet field (Fig. 16a), the expansion wave system induces instability in the shear layers of regions G1 and G2. The oscillating shear layers subsequently entrain low-velocity fluid, forming large-scale vortices that interfere and collide with each other, creating a complex multi-scale vortex interference zone. The outward expansion angle of the shear layer increases to θshear = 5.7°, with large-scale vortices (Dv = 0.3De) shedding at a frequency fvortex = 450 Hz. Analysis and comparison of the shear layer spectral characteristics in Fig. 15 reveal a strong correlation with the vortex pairing process [12]. The over-expanded jet field (Fig. 16c) exhibits a peak turbulent kinetic energy kmax = 4506 m²/s² in the recirculation zone. Spectral analysis indicates this region forms an inertial sub-zone. The collector inlet shock waves in regions I4 and I5 interfere with shear layer development, causing substantial total pressure loss in the core jet.
The nozzle jet enters the test chamber without solid wall boundary constraints, creating a strong impact on the low-velocity gas within the chamber. This induces intense turbulent mixing within the shear layer, resulting in unstable vortex structures forming inside the test chamber. The boundary of the subsonic/supersonic jet is highly unstable, causing intense alternating shock and expansion waves near the nozzle outlet. This interferes with the degree of turbulent mixing within the shear layer (peak turbulent kinetic energy within the shear layer: kmax-underexpansion = 7109 m2/s2, kmax-overexpansion = 6653 m2/s2). Without shock interference, the shear layer turbulence under ideal expansion is more thorough, with higher and more widely distributed turbulent kinetic energy within the shear layer (peak turbulent kinetic energy kmax-idealexpansion = 7725 m2/s2).
5 CONCLUSIONS
This study proposes a rapid back-pressure matching method based on the RANS approach, revealing the intrinsic trade-off mechanism between flow field quality and pressure pulsation characteristics in transonic wind tunnel test sections. Key conclusions are as follows:
1. Back-pressure matching optimization: By adjusting outlet static pressure Pout, the ideal expansion pressure (Pm = 82 kPa) is determined when the Mach number deviation at the jet centerline monitoring point is < 5 %. The uniform zone of the ideally expanded jet extends beyond the diamond-shaped region, increasing the flow field uniformity area by 23 % and reducing the Mach number standard deviation to 3.4 %. Under backpressure mismatch conditions, shock or expansion wave disturbances appear in the core region of the under/over-expanded jet field within the test chamber, degrading the flow field quality of the wind tunnel test.
2. Dominant mechanism of pressure pulsations: Under ideal expansion conditions, the absence of shock interference allows shear layer turbulence to fully develop, resulting in maximum turbulent pressure pulsation intensity. Under backpressure mismatch conditions, while shock systems generate their own pulsations, they simultaneously interfere with and suppress the full development of shear layer turbulence, leading to a relative reduction in overall pressure pulsation intensity.
3. Engineering trade-off principle: Low-frequency turbulent pressure pulsations dominate within the test chamber. Research indicates that suppressing turbulent mixing via shock waves can reduce pressure pulsation levels, but this requires sacrificing 7 % to 15 % of flow field uniformity. Accordingly, backpressure schemes can be selected based on test requirements: ideal expansion conditions are preferred for high-precision aerodynamic testing, while scenarios sensitive to pressure pulsations (e.g., precision measurements requiring low disturbance) may tolerate moderate backpressure mismatch. This study provides theoretical support for selecting backpressure matching strategies in supersonic wind tunnel tests, establishes a quantitative relationship between flow field uniformity and internal pressure pulsation intensity, and offers guidance for enhancing the reliability of wind tunnel test data.
References
- Yang, B., Liu, S. Investigation of the performance of flow field in supersonic/hypersonic wind tunnel with different test section geometry configurations. J Exp Fluid Mech 4 59-64 (2014) DOI:10.11729/syltlx20130023. (in Chinese)
- Lu, J., Sheng, M., Liao, D., Wang, H. Investigation about transonic wind tunnel test section noise mechanism based on experimental. Acta Aerodyn Sin 32 488-492 (2014) DOI:10.7638/kqdlxxb-2012.0151. (in Chinese)
- Gnani, F., Zare-Behtash, H., White, C., Kontis, K. Effect of back-pressure forcing on shock train structures in rectangular channels. Acta Astronaut 145 471-481 (2018) DOI:10.1016/j.actaastro.2018.02.010.
- Rodríguez Lastra, M., Oro, J.M.F., Vega, M.G., Marigorta, E.B., Morros, C.S. Novel design and experimental validation of a contraction nozzle for aerodynamic measurements in a subsonic wind tunnel. J Wind Eng Ind Aerodyn 118 35-43 (2013) DOI:10.1016/j.jweia.2013.04.008.
- Kulkarni, V., Sahoo, N., Chavan, S.D. Simulation of honeycomb-screen combinations for turbulence management in a subsonic wind tunnel. J Wind Eng Ind Aerodyn 99 37-45 (2011) DOI:10.1016/j.jweia.2010.10.006.
- Liu, P., Cai, J.L., Shao, X.J., Jin, H. Research on a rapid method for obtaining the matching point of the static operating pressure of a supersonic jet in a wind tunnel. Stroj Vestn-J Mech E 71 114-126 (2025) DOI:10.5545/sv-jme.2024.1199.
- Feng, M.Y., Huang, S.H. Optimization on secondary-throat of supersonic wind tunnel with different model blockage. J Propuls Technol 33 105-110 (2012). (in Chinese)
- Xiong, B., Wang, Z.G., Fan, X.Q., Wang, Y. Experimental study on the flow separation and self-excited oscillation phenomenon in a rectangular duct. Acta Astronaut 133 158-165 (2017) DOI:10.1016/j.actaastro.2017.01.009.
- Zhang, J., Yuan, H., Wang, Y., Huang, G. Experiment and numerical investigation of flow control on a supersonic inlet diffuser. Aerosp Sci Technol 106 106182 (2020) DOI:10.1016/j.ast.2020.106182.
- Sandham, N.D., Reynolds, W. Three-dimensional simulations of large eddies in the compressible mixing layer. J Fluid Mech 224 133-158 (1991) DOI:10.1017/S0022112091001684.
- Tam, C.K.W. Supersonic jet noise. Annu Rev Fluid Mech 27 17-43 (1991) DOI:10.1146/annurev.fl.27.010195.000313.
- Bogey, C., Bailly, C., Juvé, D. Numerical simulation of sound generated by vortex pairing in a mixing layer. AIAA J 38 2210-2218 (2000) DOI:10.2514/2.906.
- Zhi, H., Xiao, T., Qin, N., Deng, S., Lu, Z. On-the-fly unsteady adjoint aerodynamic and aeroacoustic optimization method. AIAA J 62 4779-4797 (2024) DOI:10.2514/1.J064455.
- Anderson, J.D. Fundamentals of Aerodynamics. (2010) McGraw-Hill Education, New York.
- Balabel, A., Hegab, A.M., Nasr, M., El-Behery, S.M. Assessment of turbulence modeling for gas flow in two-dimensional convergent-divergent rocket nozzle. Appl Math Model 35 3408-3422 (2011) DOI:10.1016/j.apm.2011.01.013.
- Hutchins, N., Marusic, I. Evidence of very long meandering features in the logarithmic region of turbulent boundary layers. J Fluid Mech 579 1-28 (2007) DOI:10.1017/S0022112006003946.
- Larsson, J., Kawai, S., Bodart, J., Bermejo-Moreno, I. Large eddy simulation with modeled wall-stress: recent progress and future directions. Mech Eng Rev 3 15-00418 (2016) DOI:10.1299/mer.15-00418.
- Williams, J.F., Hawkings, D.L. Sound generation by turbulence and surfaces in arbitrary motion. Philos Trans A Math Phys Eng Sci 264 321-342 (1969) DOI:10.1098/rsta.1969.0031.
- Fröhlich, J., Von Terzi, D. Hybrid LES/RANS methods for the simulation of turbulent flows. Prog Aeosp Sci 44 349-377 (2008) DOI:10.1016/j.paerosci.2008.05.001.
- Patel, S.K., Mathew, J. Shock capturing in large eddy simulations by adaptive filtering. Fluids 4 132 (2019) DOI:10.3390/fluids4030132.
- Poinsot, T.J.A., Lelef, S.K. Boundary conditions for direct simulations of compressible viscous flows. J Comput Phys 101 104-129 (1992) DOI:10.1016/0021-9991(92)90046-2.
- Menter, F.R., Egorov, Y. The scale-adaptive simulation method for unsteady turbulent flow predictions. Part 1: theory and model description. Flow Turbul Combust 85 113-138 (2010) DOI:10.1007/s10494-010-9264-5.
- ASME V V 20. Standard for Verification and Validation in Computational Fluid Dynamics and Heat Transfer. American Society of Mechanical Engineers (2021) New York.
- Roache, P.J. Verification and Validation in Computational Science and Engineering. (1998) Hermosa Publishing, Albuquerque.
- Ermolaev, Y.G., Kosinov, A.D., Kocharin, V.L., Semenov, A.N., Semionov, N.V., Shipul, S.A., Yatskikh, A.A. Effect of small angles of attack on laminar-turbulent transition in the supersonic boundary layer on a swept wing with χ = 72°. Fluid Dyn 57 30-36 (2022) DOI:10.1134/S0015462822010037.
- Huang, W., Wu, H., Yang, Y.G., Yan, L., Li, S.B. Recent advances in the shock wave/boundary layer interaction and its control in internal and external flows. Acta Astronaut 174 103-122 (2020) DOI:10.1016/j.actaastro.2020.05.001.
- John, D.A. Computational Fluid Dynamics: The Basic with Application. Tsinghua University Press (2002) Beijing.
- Narasimha, R., Sreenivasan, K.R. Relaminarization of fluid flows. Adv Appl Mech 19 221-309 (1979) DOI:10.1016/S0065-2156(08)70311-9.
- Smits, A., Dussauge, J.P. Turbulent Shear Layers in Supersonic Flow (1996) American Institute of Physics, Woodbury.