


1 INTRODUCTION
Within the broader scope of mechanical engineering, the pursuit of high-precision, defect-free, and sustainable material removal solutions remain a paramount objective for the fabrication of critical components. In this context, abrasive water jet (AWJ) machining has emerged as a critical research domain in advanced manufacturing technologies, distinguished by its thermally insensitive material removal mechanism, multi-material processing capability, and enhanced process flexibility [1-5]. It is frequently used to process difficult-to-machine materials such as glass [6,7], cemented carbide [8-10], composites [11-14], ceramics [15,16]. This non-thermal machining technique employs a 300 MPa to 400 MPa ultra-high pressure water-jet laden with micron-scale abrasive particles, which are accelerated through an optimized focusing nozzle to generate coherent high-velocity abrasive-waterjet streams. The material removal mechanism primarily relies on localized mechanical erosion process induced by the high-momentum impact of abrasive particles, achieving precise material removal while preserving substrate microstructure integrity. For the mechanical engineering community, preserving surface integrity without inducing thermal distortion directly translates to improved fatigue life and the enhanced reliability of mechanical systems. Particularly in aerospace component fabrication, AWJ technology demonstrates unique advantages in processing complex geometries in advanced aerospace systems, offering superior surface integrity and dimensional accuracy compared to conventional thermal-based machining methods [16-20].
Despite these inherent advantages, empirical optimization of AWJ’s complex process parameters remains challenging and costly. Consequently, researchers have increasingly utilized finite element analysis (FEA) to elucidate material removal mechanisms and refine machining parameters. Early simulation models investigated the effects of particle shape, velocity, and impact angle on material removal, utilizing erosion pit roundness to evaluate simulation accuracy [21]. Subsequent studies further enhanced model stability and physical realism by optimizing dynamic impact intervals and incorporating particle rotation [22]. Building on these foundations, Anwar et al. [23] employed the Johnson-Cook material formulation to simulate single and overlapping particle impacts on Ti6Al4V during controllable depth milling. Their model successfully captured complex phenomena, including plastic deformation, particle fragmentation, material pile-up, and residual stress. While the predicted pit depths and indentation widths closely matched experimental data (with errors under 5 % at high erosion angles), prediction accuracy decreased at shallower impact angles, consistent with earlier findings [21]. Collectively, these numerical studies establish a critical framework for setting parameters in AWJ simulation modeling.
Regarding the study of single-impact abrasive particles, Anwar et al. [23] developed a 3D finite element model for AWJ overlapping path milling, taking into account the abrasive particle size distribution and edge sharpness. By varying parameters such as water pressure, step size, and path count, they predicted erosion profiles and material removal rates. The model achieved erosion depth errors below 15 % and removal rate errors below 8 %, providing valuable insights for optimizing abrasive particle distribution in contour-controlled milling. Kevorkijan et al. [24] numerically investigated particle-induced erosion in a cavitating flow within a Pelton turbine using CFD coupled with Lagrangian particle tracking and the Finnie erosion model, providing insights into erosion mechanisms in high-velocity particle-laden flows relevant to abrasive waterjet machining. Torrubia et al. [25] combined finite element analysis and Monte Carlo optimization to develop a more accurate simulation model for abrasive particle behavior in AWJ erosion. These models can predict both the average machining channel profile and surface fluctuations while considering correlations among random parameters such as particle sharpness, size, and incident angle, thereby helping to explain unexpected machining deviations.
Liu et al. [26] established an AWJ CFD erosion field model to simulate dynamic characteristics under steady-state, turbulent, two-phase, and three-phase conditions. They tracked the energy distribution of high-pressure water and abrasive particles, finding that particles of different sizes showed varying energy attenuation, though the overall attenuation trend was consistent. Long et al. [27] used the Euler-Lagrangian method to simulate the erosion field flow within the focusing tube, tracking abrasive particle trajectories with a discrete particle model. They found that gas entrainment at the tube entrance increases tangential velocity, raising particle-wall collision likelihood. Additionally, extending the tube length and reducing the particle shape factor effectively reduced axial particle velocity and improved acceleration. Feng et al. [28] proposed a coupled method using FEA and smoothed particle hydrodynamics (SPH) to simulate the process of water jet erosion on both rigid and plastic materials. This method describes the influence of jet deformation and pressure propagation at different erosion velocities on the erosion depth and pit aperture. It provides valuable insights for understanding the cutting mechanism and optimizing process parameters. Despite these significant advancements in CFD-based AWJ modeling, most existing studies have primarily focused on macroscopic erosion profiles, nozzle wear, or general energy distribution. The localized micro-hydrodynamic behavior within the machining zone, particularly the dynamic evolution of the stagnation zone and its subsequent interference with particle trajectories, remain insufficiently quantified in numerical models.
During the multi-step erosion process, the deepening of the erosion channel, along with changes in particle motion and stagnation zone size, significantly influence particle trajectories and the overall material removal performance of the AWJ. Despite the importance of these phenomena in industrial mechanical applications, comprehensive numerical quantification of the stagnation zone’s dynamic characteristics remains limited in current literature. Building upon the foundational findings of our previous work [29,30], the primary contribution of this study is to systematically calibrate and quantify the stagnation zone characteristics using an advanced CFD framework. Rather than solely relying on experimental observation, this research provides an in-depth numerical examination of how the stagnation zone specifically dictates abrasive particle deflection during both normal and inclined multi-step erosion processes. By comparing simulation results with experimental data, the study validates the influence of stagnation zones on effective kinetic energy utilization and profile evolution. Finally, the paper proposes strategies to minimize stagnation zone size and optimize the material removal capacity, offering valuable guidance for optimizing practical manufacturing processes and contributing to the broader field of advanced mechanical machining.
2 METHODS
2.1 Simplified Simulation Model
AWJ erosion primarily results from the high-energy jet stream generated by the interaction of air, water, and abrasive particles with the workpiece, as depicted in Fig. 1a. For model simplification and improved computational performance, during perpendicular impingement scenarios, a quarter-section of the jet stream field is considered, focusing on the waterjet state after the focusing tube exit due to its structural symmetry. Conversely, to ensure physical and mathematical validity during inclined impingement simulations, where the dual-symmetry of the flow field is inherently broken, the computational domain is explicitly expanded to a 1/2 symmetric domain. This expansion is strictly required to accurately capture the asymmetric flow deflection and cross-flow dynamics induced by the impact angle. The initial boundary conditions are illustrated in Fig. 1b. To accurately capture the dynamic behavior of the erosive waterjet at the workpiece surface, local mesh refinement is applied in the region of interaction between the erosion field and the workpiece. The flow field, abrasive particle trajectories, stagnation zone, and other key features of the high-energy jet stream are modeled and captured using ANSYS Fluent 15.0 (ANSYS Inc., Cecil Township, USA). The κ–ω shear stress transport (SST) turbulence model is employed due to its superior robustness in near-wall regions and reduced sensitivity to free-stream conditions, providing improved convergence compared to the standard κ–ε model. To fully utilize the capability of the κ-ω SST model in resolving the viscous sublayer, the boundary layer mesh at the workpiece surface was locally refined (as illustrated in Fig. 1b). Consequently, the dimensionless wall distance y+ of the first grid layer in the impingement zone is strictly controlled. The simulation results indicate a maximum y+ value of 2.6 and an average y+ value of approximately 1.1 at the target surface.
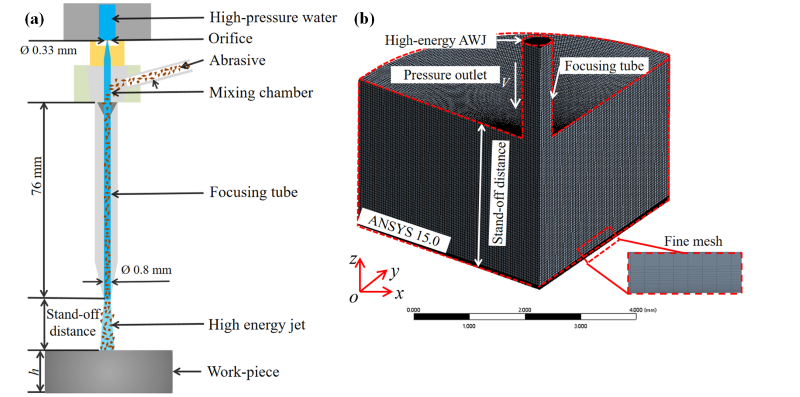
Fig. 1. High-energy jet formation principle with the simplified CFD simulation domains; a) AWJ erosion system diagram, and b) Initial boundary conditions for simplified CFD simulation domain
2.2 Mesh Sensitivity Analysis
Mesh quality is critical to simulation accuracy and computational success. While larger mesh sizes can reduce computation time and accelerate convergence, they may compromise result accuracy by distorting parameter variations. Conversely, smaller mesh sizes improve accuracy but increase computational time and risk simulation interruptions. Therefore, selecting an optimal mesh size requires a mesh sensitivity analysis to balance accuracy and computational cost.
In this simulation, evaluation was conducted on mesh size of 0.002 mm, 0.005mm, 0.010 mm, 0.025 mm, and 0.05 mm. To ensure a rigorous evaluation, the radial cross-sectional velocity profile at the focusing tube outlet (Fig. 2a), the downstream velocity profile located 15 mm from the outlet (Fig. 2b), the turbulent kinetic energy distribution (Fig. 2c), and the total simulation time (Fig. 2d) were collectively compared. To quantify the accuracy, the average error of the flow velocity profile was defined as the mean absolute percentage difference between the simulated velocity data points and the theoretical velocity distribution derived from reference across the radial cross-section [29]. The results indicated that as the mesh size varied from 0.002 mm to 0.050 mm, the average errors in the velocity profile at the high-pressure water outlet were 1.73 %, 1.74 %, 2.46 %, 3.45 %, and 5.69 %, respectively. With decreasing mesh size, the profile error gradually reduced.
Furthermore, fully developed pipe flows may exhibit diminished sensitivity to grid resolution. To address this, the flow behavior in the highly sensitive downstream domain was evaluated, as depicted in Fig. 2b. While coarser mesh suffer from severe numerical dissipation and fail to maintain the steep gradients of the high-speed water-jet core, the 0.005 mm mesh successfully captures the sharp jet interface. Since second-order turbulent quantities are extremely sensitive to grid resolution, the turbulent kinetic energy distribution was plotted (Fig. 2c). The coarse mesh completely fails to capture the sharp near-wall turbulent kinetic energy peaks generated by intense shear, whereas the 0.005 mm mesh perfectly resolves these extreme gradients, achieving nearly identical results to the finest 0.002 mm mesh. As illustrated in Fig. 2d, reducing the mesh size from 0.005 mm to 0.002 mm resulted in a 23 % increase in simulation time, with limited improvement in profile accuracy. Therefore, a mesh size of 0.005 mm was determined to sufficiently meet the sensitivity analysis requirements without significantly affecting simulation accuracy.
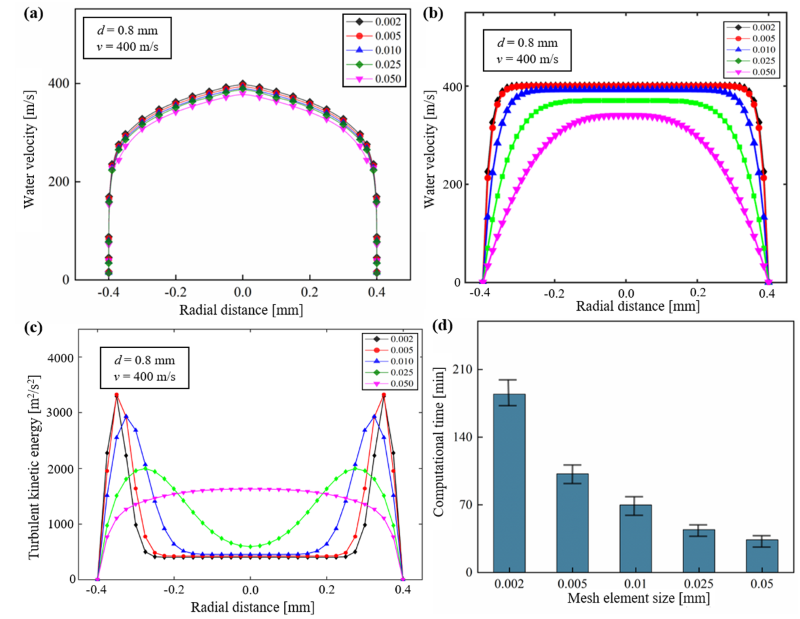
Fig. 2. Mesh sensitivity analysis evaluating the effects of mesh size on a) and b) water flow velocity, c) turbulent kinetic energy, and d) computational time demand
2.3 Discrete element particle simulation calculation method
AWJ simulation entails considerable computational complexity, mainly due to the difficulty in accurately capturing abrasive particle motion within the jet and their interaction with the workpiece surface. The key challenges include:
1. Grid resolution and particle tracking: Particle trajectory accuracy is highly sensitive to grid size. Larger grids reduce computation time but risk trajectory loss, while smaller grids improve accuracy at the cost of significantly increased computation time and convergence difficulty.
2. Phase coupling: Abrasive particle kinetic energy is derived from the high-pressure waterjet, requiring careful optimization of parameters governing the interaction between the discrete (abrasive) and continuous (water) phases. Poor parameter choices can lead to large errors in predicting particle motion and impact behavior.
3. Computational parameter sensitivity: Factors such as relaxation coefficients, particle shape, volume fraction distribution, and time step resolution greatly affect simulation accuracy. Proper calibration of these parameters is essential for reliable erosion modeling and efficient convergence.
To accurately resolve particle trajectories, the discrete phase model (DPM) is employed. Based on a Lagrangian framework, DPM tracks individual dispersed particles, while the continuous phase-comprising water and air-is modeled using an Eulerian approach. Interaction between the two phases is governed by momentum, energy, and mass conservation equations. This coupling ensures a comprehensive representation of particle motion, energy transfer, and erosion behavior.
For discrete-phase particles in an erosive jet, particle velocity and trajectory are inevitably influenced by the surrounding fluid. Based on Newton’s second law, the forces exerted on particles within the flow field can be systematically analyzed to determine their motion. Through this force analysis, the governing equation for the discrete-phase motion can be formulated as follows [31]:
=
m_ag+\overrightarrow{F_D}
+\overrightarrow{F_V}
+\overrightarrow{F_P}
+\overrightarrow{F_L},
\tag{1}$$
where the virtual mass force \(\overrightarrow{F_V}\), pressure gradient force \(\overrightarrow{F_P}\), buoyancy force \(\overrightarrow{F_L}\) can be neglected during the high-speed erosion of particles, and the drag force per unit mass of particles \(\overrightarrow{F_D}\) can be expressed as [32]:
=
\frac{18\mu}{\rho_a d_a^2}
\frac{C_D Re_{sp}}{24},
\tag{2}$$
where da is the diameter of the particle, Resp is the relative Reynolds number based on the particle size, and the drag coefficient CD depends on the shape of the particle, which can be divided into spherical and non-spherical particles. For spherical particles:
=
a_1+\frac{a_2}{Re_{sp}}
+\frac{a_3}{Re_{sp}^2}.
\tag{3}$$
For non-spherical particles:
=
\frac{24}{Re_{sp}}
\left(1+b_1Re_{sp}^{b_2}\right)
+
\frac{b_3Re_{sp}}
{b_4+Re_{sp}},
\tag{4}$$
where a1 and a2 are constants for spherical particles within the range of particle Reynolds number, and relevant data can be found in reference [33]. The values of b1 to b4 are calculated using the following formulas:
=
\exp\!\left(
2.3288
-6.4581S_a
+2.4486S_a^2
\right) ,
\tag{5}$$
=
0.0964+0.5565S_a,
\tag{6}$$
=
\exp\!\left(
4.905
-13.8944S_a
+18.4222S_a^2
-10.2599S_a^3
\right) ,
\tag{7}$$
=
\exp\!\left(
1.4681
+12.2584S_a
-20.7322S_a^2
+15.8855S_a^3
\right) ,
\tag{8}$$
where Sa is the particle’s sphericity. It is acknowledged that localized erosion mechanisms are profoundly dictated by the precise micro-impact angle and spatial orientation of the abrasive grains. For reliable micromechanical analysis, modeling particles as super ellipsoids [34] or precise non-sphericals [35] while analytically resolving their hydrodynamic torque and orientation is currently regarded as the most rigorous approach. However, dynamically resolving the motion of millions of non-spherical particles in flow simulations entails extremely high computational costs. Therefore, within the present computational framework, the sphericity factor is strictly adopted as an efficient statistical approximation. Although it does not resolve the rotational torque of individual particles, it effectively corrects macroscopic drag variations and accurately predicts the overall trajectory distribution of the particle swarm.
Building on the analysis of particle motion in the erosive jet, the next step involves applying the Euler-Lagrange method to accurately track abrasive particle trajectories. This will enable a detailed investigation of their impact behavior on the eroded workpiece, including the characterization of the critical “secondary impact” phenomenon in the erosion process.
Particle trajectories are tracked using a transient, multiphase, one-way coupled Euler-Lagrange model. Abrasive particles are injected at the inlet of the high-energy jet, with the flow rate limited to below 5 g/min and a shape factor of 0.76 [23] to minimize collision and fragmentation effects. The abrasive material adopted in the experiment is #80 garnet (with a density of 4.2 g/cm³), which exhibited a non-uniform size distribution. To simulate multiphase flow using DPM, specific particle size ranges must be defined. In the proposed model, the Rosin-Rammler distribution was adopted to describe the probability distribution of the particle size. Initially, the particles were graded using a series of standard sieves, yielding the mass fractions shown in Fig. 3a. As indicated in Fig. 3b, the particle size probability density function could not be approximated as a Gaussian distribution. Therefore, the inverse transform sampling method was employed to generate pseudo-random numbers conforming to the actual probability distribution. To achieve this, the cumulative distribution function (CDF) was derived from the data in Fig. 3a. Furthermore, the cumulative mass fractions for various size ranges were determined as shown in Fig. 3b, providing the necessary prerequisites for determining the Rosin-Rammler parameters in the DPM model.
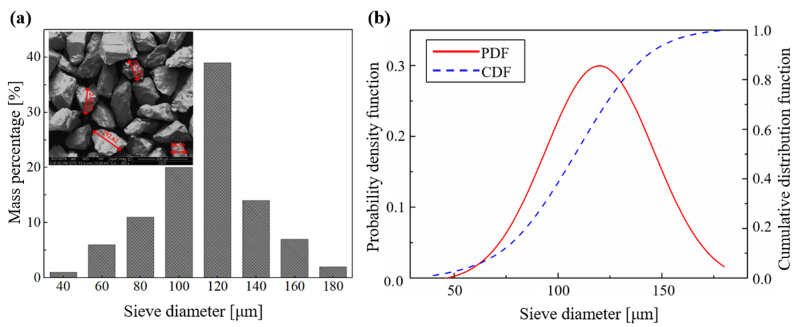
Fig. 3. a) Particle size distribution characteristics, and b) probability functions of Garnet #80 abrasives
The Rosin–Rammler distribution describes the division of the entire particle size range into several discrete size groups, where each group is represented by a single particle stream in the group jet source. It assumes that an exponential relationship exists between the particle diameter pa and the cumulative mass fraction Ya of particles:
=
e^{-\left(p_a/\bar{p}\right)^n},
\tag{9}$$
where \(\bar{p}\) (approximately 115 μm) is the mean diameter; n (approximately 3.1) is the spread parameter, which is an essential physical quantity in the DPM model.
Analysis of simulated particle trajectories (Fig. 6), using a Rosin-Rammler distribution for varying particle sizes, reveals several key findings. In this DPM simulation, the particle-wall interactions are modeled by the normal (en) and tangential (et) restitution coefficients. To accurately reflect the momentum loss during the primary impact, en and et are defined as polynomial functions of the impact angle α, governed by these parameters [36]:
e_n &= 0.993 – 1.76\alpha + 1.56\alpha^2 – 0.49\alpha^3,\\
e_t &= 0.988 – 1.66\alpha + 2.11\alpha^2 – 0.67\alpha^3.
\end{aligned}
\tag{10}$$
3 RESULTS AND DISCUSSION
3.1 Flow Characteristics of the Stagnation Zone
The stagnation zone, an intrinsic characteristic of the erosive jet, naturally forms as the high-energy flow field interacts with the target material. By modifying the local hydrodynamics, this high-pressure zone intrinsically decelerates the jet, deflects the fluid flow, and consequently alters the actual trajectories and final impact angles of the entrained abrasive particles [37-39]. Furthermore, the dynamic behavior within this stagnation zone is widely recognized as the primary source of the regular ripple patterns that appear on the machined surface. When machining deep and narrow profiles, the restricted exhaust of fluids and particles significantly amplifies the effect of the stagnation zone. Consequently, it is essential to thoroughly investigate this hydrodynamic influence on the jet-eroded workpiece.
The formation process of the stagnation zone can be briefly described as follows: upon the initial impact of the erosive jet against the workpiece, the stagnation zone begins to form [30]. As the flow field fully develops, the stagnation zone rapidly attains a stable, axisymmetric state. During this continuous stable phase, the stagnation zone governs the fluid deflection and particle trajectories, acting as the primary driver for macroscopic material removal and initial profile formation. This steady interaction persists continuously as long as the jet maintains a stable impingement on the unpenetrated target material.
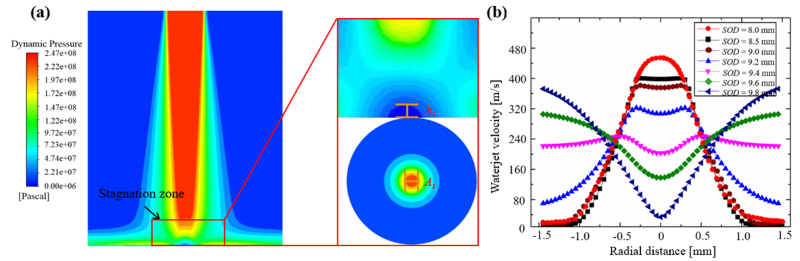
Fig. 4. Stagnation zone characteristics with the conditions are: P = 250 MPa, abrasive flow rate = 5 g/min, θ = 90°;
a) structure of the erosive waterjet stagnation zone, and b) influence on the erosive waterjet velocity
Fig. 4a depicts the steady state of the stagnation zone, where simulation results confirm that the dynamic pressure approaches zero. This phenomenon occurs because the stagnation process converts kinetic energy into static pressure. Consequently, the region of lowest dynamic pressure corresponds to the highest static pressure. To quantify the zone’s geometry, the stagnation zone projection area (As) is defined by the width of the uniform velocity interval on the jet cross-section at a distance of 8.5 mm, as shown in Fig. 4b. At a distance of 8.0 mm, the jet remains within the free-flight regime, exhibiting a Gaussian velocity profile unaffected by the stagnation zone [40-42]. However, at 8.5 mm, the erosive waterjet enters the stagnation zone, where the centerline velocity initially plateaus. As the jet progresses toward the workpiece, the retarding influence of the stagnation zone intensifies, causing the centerline velocity to decay until it reaches zero at the surface, resulting in lateral deflection. Therefore, to explicitly define this physical boundary from the CFD results, the stagnation zone thickness (hs) is quantitatively defined as the vertical distance from the workpiece surface to the exact axial location where the radial velocity profile plateaus and the centerline deceleration originates (i.e., stand-off distance, SOD = 8.5 mm). With both the thickness and area quantitatively defined, the subsequent analysis focuses on how key machining parameters influence these dimensions to elucidate the dynamic behavior of the stagnation zone.
3.2 Dimensional Characterization of the Stagnation Zone
In Section 3.1, the fundamental characteristics of the stagnation zone were analyzed. Building upon these findings, this section employs CFD simulation techniques to calibrate its dimensions by integrating the previously defined thickness and area. The selected experimental parameters include water pressure (P), stand-off distance (SOD), and erosion angle (θ) and abrasive flow rate (\({\dot m_{a0}} \)), The chosen parameter settings are detailed in Table 1.
Table 1. Machining variables selected for stagnation zone dimensional marking
| No. | P [MPa] | SOD [mm] | θ [°] | \({\dot m_{a0}} \) [g/min] | ||||||||
|---|---|---|---|---|---|---|---|---|---|---|---|---|
| 1 | 200 | 250 | 300 | 10 | 90 | 5 | ||||||
| 2 | 250 | 5 | 10 | 15 | 90 | 5 | ||||||
| 3 | 250 | 10 | 60 | 75 | 90 | 5 | ||||||
| 4 | 250 | 10 | 90 | 2 | 5 | 8 | ||||||
CFD simulation results under varying machining parameters reveal distinct variations in the thickness and area of the stagnation zone, as depicted in Fig. 4a. During normal impingement conditions, the projected area of the stagnation zone approximates a circular shape, whereas during inclined impingement, the projected area of the stagnation zone approximates an elliptical shape. Fig. 5a presents an analysis of stagnation zone characteristics under different water pressures. The findings indicate that increasing the water pressure does not significantly impact the stagnation zone’s thickness and area, suggesting that the dimensions of the stagnation zone are not influenced by changes in water pressure. This observation implies that the size of the stagnation zone does not strictly correlate with the intensity of the erosion field. In other words, the stagnation zone’s dimensions do not reflect the material removal capability of the AWJ.
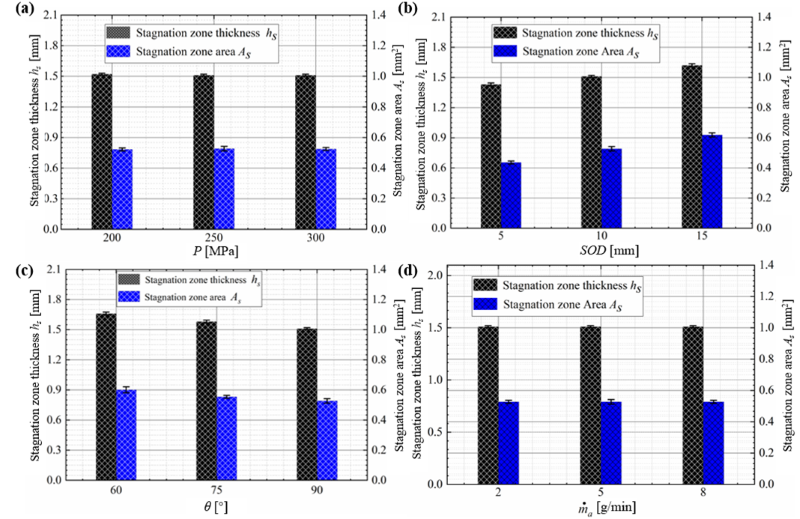
Fig. 5. The stagnation zone size marking results with different; a) water pressure, b) stand-off distance, c) erosion angle, and d) abrasive flow rate
As the stand-off distance increases (Fig. 5b), the thickness of the stagnation zone correspondingly grows, accompanied by an expansion in its overall area, this suggests a synchronized variation between the stagnation zone’s thickness and area with changes in stand-off distance. A similar trend is observed when altering the erosion angle, as shown in Fig. 5c. Simulation results indicate that as the waterjet’s erosion angle increases, both the thickness and area of the stagnation zone exhibit a decreasing trend. Conversely, when the erosion angle decreases, the inclined impingement effect of the waterjet effectively increases the equivalent target distance, leading to a variation trend analogous to that observed with increasing stand-off distance. Hence, its variation trend is similar to that of the stand-off distance. It’s important to note that despite the similar size variation trend in Fig. 5b and Fig. 5c, their erosion capabilities differ significantly, as discussed in reference [33]. A comparative analysis of the abrasive flow rate’s influence on stagnation zone dimensions, as illustrated in Fig. 5d, reveals no statistically significant correlation when contrasted with Fig. 5a. The formation of the stagnation zone can be attributed predominantly to hydraulic pressure effects. Abrasive flow rate does not directly influence the dimensions of the stagnation zone; rather, the stagnation zone affects the erosion angle of abrasive particles [29].
In comparison to inclined impingement, during normal impingement, the probability of abrasive particles being deflected due to the stagnation zone increases. This means that some abrasive particles are refracted away, resulting in a reduction in the effective number of abrasive particles acting on the workpiece and thereby lowering the material removal rate. In contrast, under optimal inclined impingement conditions, the probability of abrasive particle deflection is minimized, allowing a greater proportion of kinetic energy to be effectively transferred to the workpiece. As a result, inclined impingement enhances material removal rate by improving the energy utilization of abrasive particles.
3.3 Trajectory Analysis of Abrasive Particles
Accurately capturing abrasive particle motion in high-energy erosive jets is crucial, as it reveals particle velocity and trajectory while enabling precise prediction of erosion locations and intensities. In AWJ machining of titanium alloys, abrasive particles are key to material removal. Tracking their impact positions using a DPM allows for effective evaluation of erosion channel formation and deeper insight into the underlying erosion mechanisms.
Driven by these precisely defined momentum transfer mechanisms in section 2.3, the distinct motion patterns of different-sized particles can be clearly traced. It is observed that particle size is directly proportional to acquired energy, with larger particles rebounding higher post-erosion. While “secondary impact” abrasives originate from initial impacts within the particle stagnation zone, their probability of occurrence there is independent of particle size, allowing smaller particles to also exhibit this phenomenon. However, larger particles have a higher probability of entering the stagnation zone. This zone significantly influences internal particle motion, causing previously collided particles to deviate laterally, thereby reducing erosion energy, and deflecting smaller particles at the jet’s edge sideways upon exit, resulting in a broader erosion profile. Notably, most secondary impact locations (indicated by red points in Fig. 6a) are positioned outside the stagnation zone.
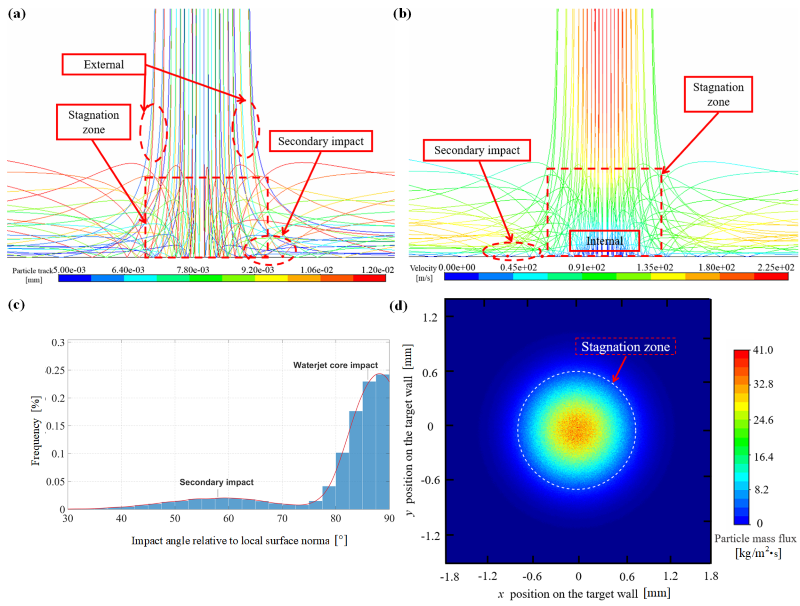
Fig. 6. Numerical simulation results of particle-wall interaction behaviors and erosion dynamics, with conditions of P = 100 MPa, abrasive flow rate = 5 g/min, SOD =5 mm;
a) an erosion trajectory tracking for different particle size dimensions, b) abrasive erosion velocity tracking, c) distribution of particle impact angles, and d) particle impact flux density
Further analysis of the particle trajectories and velocity tracking (Fig. 6a and b), indicates that abrasive particles experiencing “secondary impact” exhibit a drastic velocity reduction of at least 90% during their second impact compared to their initial strike. Within the central stagnation zone, some particles undergo severe collisions that reduce their velocities to near zero, indicating that their kinetic energy is predominantly absorbed by the workpiece for material removal. To quantify the spatial distribution of these energetic impacts, Fig. 6d presents the contour map of the particle mass flux density. It is evident that the vast majority of the impact flux is highly concentrated within the circular stagnation zone, which bears the brunt of the primary erosion. Conversely, as particles diverge from the outer edge of this stagnation zone due to the lateral jet action, the mass flux decreases significantly. However, these deflected particles still retain relatively high kinetic energy, which acts as the primary driver for the lateral widening of the erosion profile. Additionally, particles that have already deviated to both sides of the stagnation zone can occasionally experience a velocity increase, attributed to secondary momentum exchange with the high-speed lateral waterjet.
The distinct material removal mechanisms across these regions are further elucidated by the statistical distribution of particle impact angles, as shown in Fig. 6c. The histogram exhibits a highly left-skewed distribution. The absolute dominant peak occurs between 80° and 90°, labeled Waterjet core impact, confirming that the high-flux particles in the stagnation zone strike the surface almost perpendicularly, primarily inducing severe deformation wear. Meanwhile, a distinct shoulder distribution extending from 45° to 75° perfectly captures the “secondary impact” and laterally deflected particles. These particles strike the periphery at shallower angles, shifting the local erosion mechanism towards cutting and plowing wear.
To further understand the dynamics of these shallower-angle interactions, a detailed statistical analysis was performed on the occurrence rate of secondary impact events among abrasive particles. The frequencies of these events were recorded for abrasive flow rates of 3 g/min, 5 g/min, and 7 g/min, with the corresponding results summarized in Table 2. The results indicate that as the abrasive flow rate increases, the proportion of particles experiencing secondary impact also increases, for instance, as the abrasive flow rate was increased from 3 g/min to 5 g/min, the rate of increase in the number of particles undergoing secondary impact rose from 10.5 % to 14.8 %. Correspondingly, the growth rate of these sampled particle trajectories increased from 10.9 % to 15.1 %. A similar upward trend was observed with further increases in the abrasive flow rate.
However, in practical applications, the actual proportion of particles undergoing secondary impact is generally lower than the simulated values. This discrepancy can be attributed to several factors not accounted for in the simulation: (1) Particle interactions: The model does not account for phenomena such as inter-particle collisions and fragmentation, which significantly influence particle trajectories and behavior. (2) Mass distribution: While the DPM considers particle size distribution, it fails to fully integrate the corresponding mass distribution. Consequently, the inherently higher probability of larger, more massive particles undergoing secondary impact is not accurately captured, leading to an overestimation. (3) Energy losses: The simulation neglects energy losses from material removal mechanisms, including cutting, plowing, and the embedding of particles into the workpiece surface. These energy-dissipating processes reduce the likelihood of secondary impact under real-world conditions.
Therefore, it is necessary to recognize these limitations when interpreting the simulation results and evaluating their implications for practical applications. To ensure the statistical reliability of the erosion model, the macroscopic CFD simulation inherently tracked a large population of approximately 20,000 computational parcels. At this extensive population scale, both the macroscopic erosion profile and the momentum transfer reliably achieve a statistically stable convergence.
However, natively extracting and globally counting multi-bounce secondary impact trajectories across 20,000 overlapping particles is computationally unfeasible in standard post-processing and causes severe visual clutter. Therefore, the detailed trajectory tracking presented in Table 2 was derived using a dedicated sparse processing approach. A representative sparse subset of the escape trajectories was selectively extracted from the converged macroscopic simulation solely to visually trace and enumerate the secondary impact occurrences. Since the underlying continuous and discrete phases were completely solved using the fully converged particle population, the kinematic behavior of this sparse visual subset remains physically accurate. Consequently, employing this sparse trajectory sampling for the estimation of secondary impact proportions is a mathematically valid compromise, optimizing the visualization of micro-erosion mechanisms without compromising the integrity of the underlying large-scale flow statistics.
Table 2. Sampled particle trajectories
| \({\dot m_{a0}}\) [g/min] | Number of tracked trajectories | Number of secondary impacts | Ratio [%] |
|---|---|---|---|
| 2 | 19 | 2 | 10.5 |
| 55 | 6 | 10.9 | |
| 5 | 27 | 4 | 14.8 |
| 86 | 13 | 15.1 | |
| 8 | 63 | 10 | 15.9 |
| 105 | 17 | 16.2 |
In conclusion, although discrepancies exist between the proportion of particles undergoing secondary impact as predicted by simulations and actual conditions, these simulations still provide significant insights into the micro-level dynamics of particle impacts on the workpiece. The observed trends offer a foundational understanding of particle behavior within the erosion process. Building on these insights, subsequent research will quantitatively examine particle interaction dynamics governing material removal in multi-step AWJ erosion through synergistic integration and simulation results, establishing a predictive framework for machining process optimization.
3.4 Interaction Mechanisms on Normal Multi-Step Erosion Profile Evolution
Investigating the motion trajectories and impact mechanisms of abrasive particles during the multi-step erosion profile evolution process is critical for the development of accurate surface evolution models. To further explore the characteristics of the stagnation zone and the behavior of particle trajectories throughout this process, a comprehensive approach combining experimental techniques and CFD simulations will be employed. The specific processing parameters used in the study are detailed in Table 3, where the experimental parameters for normal erosion are designated as Group #1, and the parameters for inclined erosion are designated as Group #2. Starting with the analysis of normal erosion, boundary profiles for erosion step numbers n = 1, 3, 5, 7, 11, 20, and 30 will be extracted (Fig. 7a). Subsequently, orthogonalization of erosion width and depth are performed to explore the profile evolution process (Fig. 7 b). Furthermore, to accurately investigate the influence of the stagnation zone on particle trajectories during the surface evolution process, the specific experimental erosion profiles obtained at steps n = 1, 3, 7, and 11 were digitized and directly imported into the CFD model as fixed solid wall boundaries. Rather than dynamically simulating the continuous material removal process, this approach utilizes the actual experimental geometries as the predefined computational domains. By simulating the flow field within these exact profiles, the internal hydrodynamic characteristics and specific particle-wall interactions at different erosion stages can be precisely isolated and evaluated. The CFD simulation results are depicted in Fig. 8.
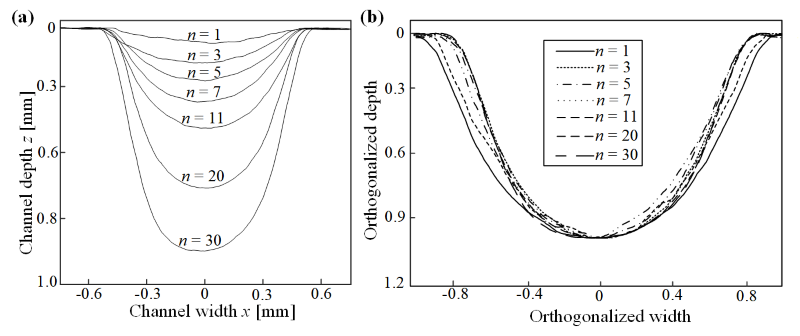
Fig. 7. a) The multi-step erosion channel depth, and b) orthogonalization depth under the experimental conditions of group # 1
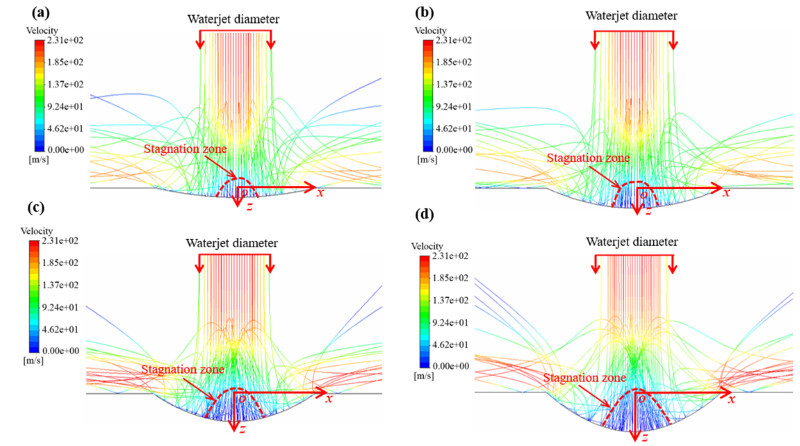
Fig. 8. Simulation results of the influence of normal multi-step erosion profile on particle trajectories; a) n = 1, b) n = 3, c) n = 7, and d) n = 11
From the multi-step erosion results shown in Fig. 7a, it can be observed that under normal erosion, the erosion depth increases nonlinearly with the progression of erosion steps, indicating a continuous decline in the incremental material removal depth per step. The corresponding CFD simulation results in Fig. 8 provide further insight into this phenomenon. Under normal erosion conditions, the width of the erosion profile exceeds the diameter of the jet, as the residual energy disperses laterally after the jet impinges on the surface. By orthogonalizing the profile width and depth for erosion steps n = 1 ~ 30 in Fig. 8a, Fig. 8b is obtained. Analyzing the orthogonalized profiles reveals that the jet normal erosion process can be divided into two stages: the first stage occurs at shallow erosion depths, such as n = 1 and n = 3, where the width and depth of the jet simultaneously increase. The second stage occurs as the erosion depth further increases, as seen in n = 5 ~ 30, where the profile depth continues to increase while the profile width ceases to grow. The deflected jet only leads to steeper sidewalls on both sides of the profile, as demonstrated in the orthogonalized profiles for n = 5 ~ 30 in Fig. 7b. The profiles from this stage exhibit a high degree of similarity within the margin of error, indicating a consistent morphological evolution pattern despite the further progression of the erosion process.
Table 3. Machining parameters setting
| \({\dot m_{a0}} \) [g/min] | P [MPa] | SOD [mm] | TS [mm/min] | n | θ [°] | |
|---|---|---|---|---|---|---|
| Group #1 | 8 | 150 | 5 | 500 | 1,3,5,
7,11,20,30 |
90 |
| Group #2 | 8 | 150 | 5 | 500 | 1,3,5,
7,11,20,30 |
70 |
Further examination of the CFD simulation results presented in Fig. 8 reveals the critical influence of the stagnation zone during the multi-step erosion process. As the channel deepens, the physical size of the stagnation zone gradually enlarges. Observing the particle trajectories, it becomes apparent that with an increase in erosion depth, there is a notable rise in the number of particles experiencing severe deflection and rebound. This phenomenon, in turn, amplifies the likelihood of inter-particle collisions, particularly with particles that have already lost momentum from prior impacts, thereby severely attenuating the effective kinetic energy available for primary material removal. This trend is most pronounced in Fig. 8d, where the trajectory patterns clearly highlight that a significant proportion of the deflected and rebounding particles converge toward the central region of the waterjet. This hydrodynamic interference thoroughly elucidates the progressive decrease in the incremental erosion depth as the cavity deepens, Moreover, the increasingly pronounced influence of the enlarged stagnation zone leads to a marked rise in the number of particles involved in “secondary erosion.” This intensified occurrence of secondary impacts further contributes to the observed degradation of the material removal capability, particularly at deeper erosion stages.
3.5 Interaction Mechanisms on Inclined Multi-Step Erosion Profile Evolution
To explore the impact of inclined waterjet erosion on the surface evolution process and how it differs from normal erosion, the same experimental methodologies and simulation approaches were applied, with processing parameters from group #2 in Table 3 being utilized for the inclined erosion scenario. Erosion boundary profiles were extracted for n = 1, 3, 5, 7, 11, 20, and 30, as shown in Fig. 9a. It was observed that, in contrast to normal erosion, the orthogonalized profiles obtained from inclined erosion nearly coincide, indicating the absence of distinct erosion stages typical of normal erosion. As the number of erosion steps increases, both the width and depth of the inclined erosion profiles show a continuous increase. Similar to normal erosion, the erosion depth in inclined erosion also follows a nonlinear growth with the number of erosion steps. By comparing the erosion depths for n = 1 in Figs. 8 and 9, it was noted that inclined erosion enhances the initial material removal capacity at initial stages. However, as the number of steps increases, the incremental erosion depth per step begins to decline. This reduction in material removal capability is attributed to the majority of abrasive particles being deflected away after the initial impact, thus diminishing the residual energy available for further material removal. It can be anticipated that, compared to normal erosion, inclined erosion results in a lower proportion of particles undergoing secondary erosion. This hypothesis will be further examined and validated through subsequent CFD simulations.
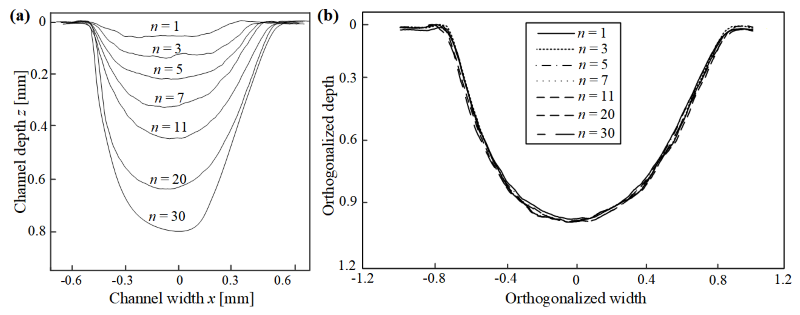
Fig. 9. a) Erosion channel morphology, and b) orthogonal analysis results under Group #2 conditions
Similarly, extraction of the experimental profiles for n = 1, 3, 7, and 11 serves as the initial boundary conditions for the CFD numerical simulation of inclined waterjet erosion, yielding simulation results as depicted in Fig. 10. Regarding the dimensions of the stagnation zone, it can be observed that the variation in size with increasing erosion depth during inclined erosion is not significant. Specifically, the stagnation zone sizes for n = 1, 3, and 7 in Fig. 10a to c are nearly identical, indicating that the stagnation zone exerts a negligible influence on particle trajectories under inclined erosion conditions. In terms of particle erosion velocity, the simulation results indicate that the deflection velocity during inclined erosion is greater than that observed during normal erosion. This suggests that after an initial collision with the workpiece, particles are refracted along the sidewall with the high-pressure water, diverting the residual erosion energy away from the workpiece, thereby leading to a reduced capacity for further penetration. This effect becomes more pronounced as erosion depth increases, as illustrated in Fig. 10d. Furthermore, when examining the number of particles undergoing “secondary erosion,” it is apparent that the particle count is relatively lower during inclined erosion. Most particles interact with the workpiece only once before being refracted away. Although these refracted particles do not converge toward the center of the jet as significantly as in normal erosion, they still retain considerable kinetic energy. However, the effective utilization of their kinetic energy for deeper material removal throughout the multi-step erosion process is lower compared to normal erosion. This diminished cutting performance can be attributed to the refracted particles not being effectively directed towards the target surface for further material removal.
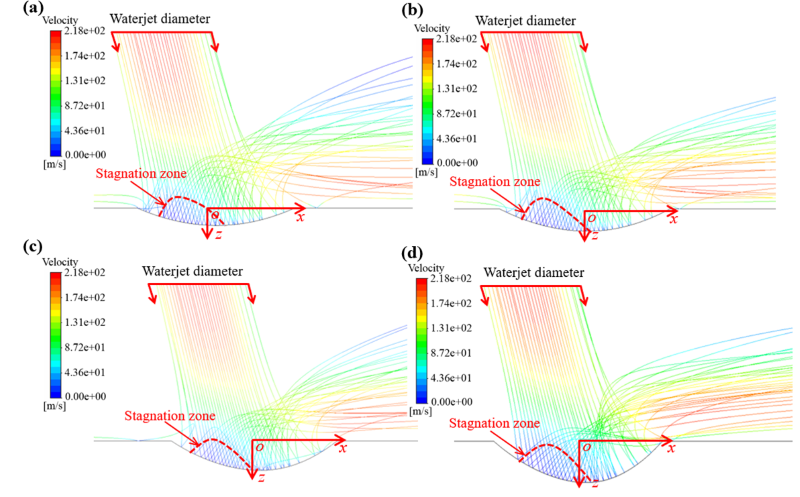
Fig. 10. Simulation results of the influence of inclined multi-step erosion profile on particle trajectories; a) n = 1, b) n = 3, c) n = 7, and d) n = 11
In summary, at low erosion step counts, inclined waterjet erosion exhibits superior material removal performance, as the refraction-induced trajectory adjustment minimizes interparticle collisions, thereby conserving kinetic energy for sustained material removal. However, as the number of erosion steps increases, normal erosion becomes more significantly influenced by the stagnation zone. Despite the occurrence of a substantial amount of secondary erosion and the convergence of abrasive particles towards the center of the jet inhibiting subsequent erosion energy in normal erosion, the phenomenon of secondary erosion occurring on the profile walls also contributes to material removal. In inclined waterjet erosion, the impact of the stagnation zone is less significant; however, refracted particles contribute more to material removal, leading to partial energy dissipation and a decline in the incremental penetration depth per step. Simulation results indicate that selecting an optimal inclination angle can improve the single-pass material removal rate while preserving the integrity of unprocessed surface regions.
The selection of the inclination angle must account for the practical feasibility and safety of the machining process. For thicker workpieces, normal erosion achieves higher overall kinetic energy utilization for continuous depth penetration. However, when surface integrity preservation is paramount and to mitigate damage from secondary particle erosion, auxiliary measures such as masking become necessary, inevitably increasing costs and clamping time.
3.6 Effect of Stagnation Zone on Machined Surface Roughness
To validate the simulation accuracy, the erosion channel was analyzed from a micro-morphological perspective. The cross-section of the erosion channel was divided into two distinct zones: the stagnation zone (Region A) and the lateral deflection zone (Region B), as illustrated in Fig. 11a. Given the symmetry of normal erosion, the analysis focuses on a single sidewall. Theoretically, material removal in ductile materials is governed by cutting and plowing mechanisms. In the stagnation zone (Region A), low fluid velocity causes particle accumulation and entrapment, which degrades surface quality, as shown in Fig. 11b. Conversely, in Region B, the high-velocity lateral deflection of the jet flushes residual particles outward. This scouring action produces a polishing effect that enhances surface smoothness and minimizes particle embedment (Fig. 11c). A comparison of these morphologies confirms that Region A exhibits pronounced erosion marks and significant particle embedment, whereas Region B is characterized by lower roughness and reduced embedment due to the smoothing effect of the lateral flow.
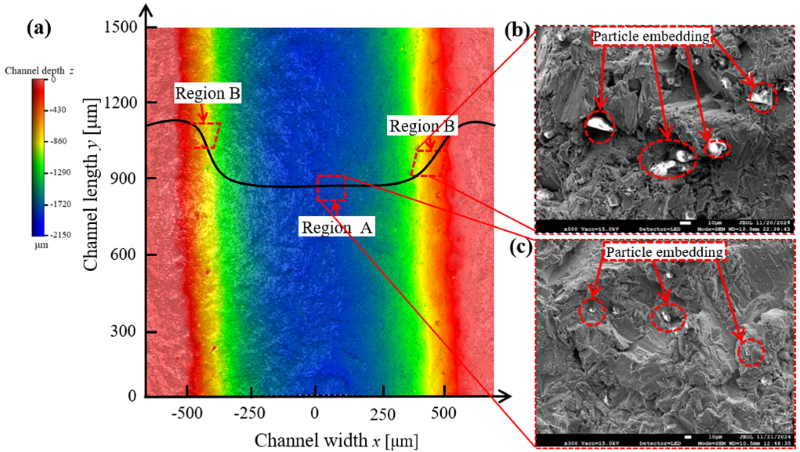
Fig. 11. Analysis of multi-step erosion channel profiles surface morphology results, with experimental parameters of P = 100 MPa, SOD = 5 mm, = 10 g/min, θ = 90°, TS = 500 mm/min, n = 5;
a) extraction of erosion channel profile morphology, b) erosion morphology of region A, and c) erosion morphology of region B
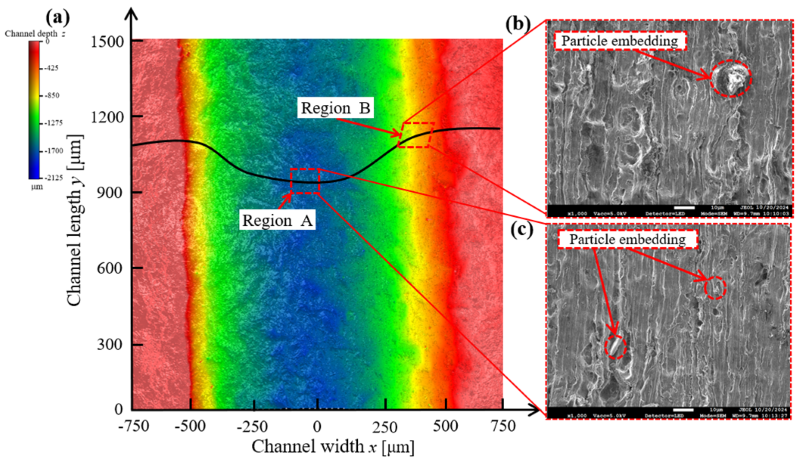
Fig. 12. Analysis of multi-step erosion channel profiles surface morphology results, with experimental parameters of P = 100 MPa, SOD = 5 mm, = 10 g/min, θ = 70°, TS = 500 mm/min, n = 5; a) extraction of erosion channel profile morphology, b) erosion morphology of region B, and c) erosion morphology of region A
In inclined erosion, region B corresponds to the lower sidewall direction, as depicted in Fig. 12a. Simulation results in Fig. 12 indicate that particles deflect along the inclination direction. Due to the asymmetrically structured stagnation zone on the workpiece surface, residual particles in this scenario tend to follow the deflected waterjet and sidewall flow path. It can be inferred that particle embedment in region A of inclined erosion is lower than in region A of normal erosion, as confirmed by the comparison in Fig. 12b. Moreover, in inclined erosion, residual particles experience less confinement and can disperse more freely along the sidewall, enhancing the smoothing effect due to their residual energy, in Fig. 12c. In inclined erosion, the surface quality in region B is notably improved, with a significant reduction in particle embedment. Due to the less constrained particle motion, inclined erosion yields lower surface roughness values compared to normal erosion, further enhancing surface finish.
3.7 Strategies for Minimizing Stagnation Zone Effects
The foregoing discussion highlights that the stagnation zone is an inherent characteristic of both normal and inclined waterjet erosion, exerting a critical influence on particle dynamics. In multi-step erosion processes, the stagnation zone substantially diminishes erosion energy, causing increased particle deflection. Thus, further investigation is required to suppress its effects and enhance erosion energy.
CFD simulations were employed to examine the stagnation zone and its effect on particle velocity at different erosion angles, as shown in Fig. 13. The results indicate that the increase in the erosion angle reduces the extent of the stagnation zone, leading to a reduction in the number of abrasive particles undergoing secondary impact. For instance, at an erosion angle θ = 45° (as shown in Fig. 13d), negligible secondary impact occurs under identical initial conditions. CFD simulation results demonstrate that the stagnation zone can be effectively suppressed by adjusting the erosion angle. However, the smallest stagnation zone does not necessarily correspond to optimal kinetic energy. As observed from the particle velocity simulations during normal impact (shown in Fig. 13a), the deflected waterjet particles exhibit lower velocities, indicating that most of the particle energy is directed toward material removal on the workpiece. During inclined impact at θ = 75°, the deflected waterjet particle velocity remains relatively low, and with a smaller stagnation zone compared to normal erosion, more material is effectively removed. When the erosion angle increases further, as in θ = 60° and θ = 45°, the particle velocity increases significantly, signaling a reduction in the erosion energy applied to the workpiece.
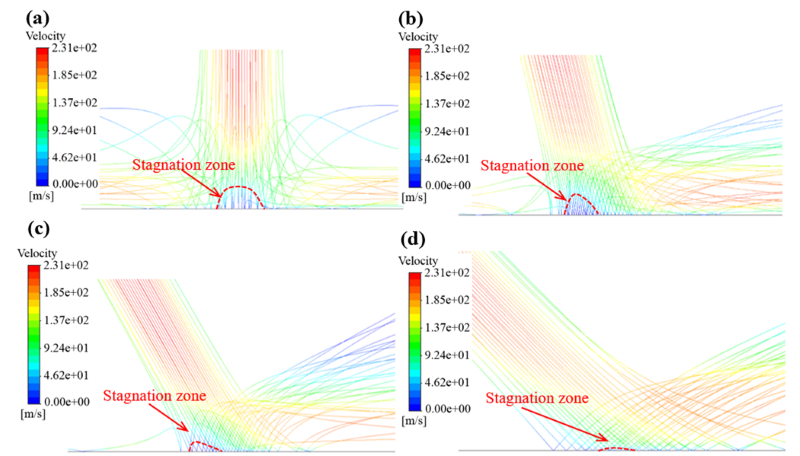
Fig. 13. Stagnation zone effects at different impingement angles; a) θ = 90°, b) θ = 75°3, c) θ = 60°, and d) θ = 45°
Based on the experimental observations and theoretical analysis presented in preceding sections, this investigation demonstrates that an optimal impingement angle exists within the erosive interaction system, at which the erosive efficacy reaches its maximum value.
4 CONCLUSION
To elucidate the complex energy utilization characteristics and morphological evolution of multi-step AWJ machining, a comprehensive CFD-DPM numerical framework was established using experimentally extracted erosion profiles as fixed geometric boundaries. Euler-Lagrange tracking explicitly reveals that the high-pressure stagnation zone governs particle deflection, transitioning the local material removal mechanism from perpendicular deformation wear at the waterjet core to shallow-angle cutting and plowing wear at the periphery. Under normal impingement, the progressive enlargement of the stagnation zone within deepening profiles severely intensifies inter-particle collisions and lateral deflections. This hydrodynamic interference attenuates the effective kinetic energy reaching the profile bottom, causing a continuous nonlinear decline in the incremental material removal depth per step. Conversely, inclined erosion exhibits superior initial penetration due to refraction-induced trajectory adjustments that minimize early-stage collisions; however, as the profile deepens, residual kinetic energy is rapidly channeled away along the sidewalls, leading to a pronounced degradation in long-term cutting performance. Ultimately, these quantitative insights into internal fluid dynamics and particle-wall interactions provide a robust theoretical foundation for optimizing nozzle inclination and maximizing the actual material removal capacity in advanced AWJ manufacturing.
References
- Axinte, D.A., Karpuschewski, B., Kong, M.C., Beacamp, A.T., Anwar, S., Miller, D., et al. High energy fluid jet machining (HEFJet-Mach): From scientific and technological advances to niche industrial applications. CIRP Ann 63 751-771 (2014) DOI:10.1016/j.cirp.2014.05.001.
- Kong, M.C., Axinte, D.A. Response of titanium aluminide alloy to abrasive waterjet cutting: Geometrical accuracy and surface integrity issues versus process parameters. P I Mech Eng B-J Eng 223 19-42 (2019) DOI:10.1243/09544054JEM1226.
- Banon, F., Sambruno, A., Batista, M., Simonet, B., Salguero, J. Evaluation of geometrical defects in AWJM process of a hybrid CFRTP/Steel structure. Int J Mech Sci 210 106748 (2021) DOI:10.1016/j.ijmecsci.2021.106748.
- Chang, S., Liu, W., Tang, J., Fan, M. Cryogenic assisted abrasive waterjet machining of Ti-6Al-4V alloy: Thermo-mechanical optimization and AI-based surface integrity prediction. Sustain Mater Tech, e01685 (2025) DOI:10.1016/j.susmat.2025.e01685.
- Patel, D., Tandon, P. Experimental investigations of thermally enhanced abrasive water jet machining of hard-to-machine metals. CIRP J Manuf Sci Tecnol 10 92-101 (2015) DOI:10.1016/j.cirpj.2015.04.002.
- Schwartzentruber, J., Papini, M. Abrasive waterjet micro-piercing of borosilicate glass. J Mater Process Technol 219 143-154 (2015) DOI:10.1016/j.jmatprotec.2014.12.006.
- Haghbin, N., Ahmadzadeh, F., Papini, M. Masked micro-channel machining in aluminum alloy and borosilicate glass using abrasive water jet micro-machining. J Manuf Process 35307-35316 (2018) DOI:10.1016/j.jmapro.2018.08.017.
- Zhang, W., Liu, D,. Zhang, Y., Dai, Y., Zhu, H., Huang, C., et al. Numerical investigations on the material response of nickel-based superalloys during abrasive waterjet milling. J Manuf Process 120 878-894 (2024) ttps://doi.org/10.1016/j.jmapro.2024.04.086.
- Maneiah, D., Shunmugasundaram, M., Reddy, A.R., Begum, Z. Optimization of machining parameters for surface roughness during abrasive water jet machining of aluminium/magnesium hybrid metal matrix composites. Mater Today Proc 271293-271298 (2020) DOI:10.1016/j.matpr.2020.02.264.
- Wang, Z., Liao, Z., Yang, Y., Dong, X., Augustinavicius, G., Yu, T., et al. Modelling and experimental study of surface treatment in abrasive waterjet peening of Nickel-based superalloy: Inverse problem. Mater Design 215 110471 (2022) DOI:10.1016/j.matdes.2022.110471.
- Klocke, F., Soo, L.S., Karpuschewski, B., Webster, J.A. Novovic, D., Elfizy, A. et al. Abrasive machining of advanced aerospace alloys and composites. CIRP Ann Manuf Techn 64 581-604 (2015) DOI:10.1016/j.cirp.2015.05.004.
- Thakur, R.K., Singh, K.K. Abrasive waterjet machining of fiber-reinforced composites: A state-of-the-art review. J Braz Soc Mech Sci 42 381 (2020) DOI:10.1007/s40430-020-02463-7.
- Thakur, R.K., Singh, K.K. Experimental investigation and optimization of abrasive water jet machining parameter on multi-walled carbon nanotube doped epoxy/carbon laminate. Measurement 164 108093 (2020) DOI:10.1016/j.measurement.2020.108093.
- Liang, W., Cheng, L., Dong, H., Guo, J., Ke, Y. Quality prediction and process optimization in abrasive waterjet cutting of ultra-thick carbon fiber reinforced polymer. Polym Composite 46 4781-4799 (2025) DOI:10.1002/pc.29277.
- Li, M., Guo, J., Zhang, X., Yang, X. Surface morphology and kerf characteristics during high-efficient abrasive waterjet trimming of 2.5 DC/SiC ceramic matrix composites. Int J Adv Manuf Tech 138 3943-3955 (2025) DOI:10.1007/s00170-025-15761-y.
- Liu, D., Huang, C.Z., Wang, J., Zhu, H.T. Material removal mechanisms of ceramics turned by abrasive waterjet (AWJ) using a novel approach. Ceram Int 47 15165-15172 (2021) DOI:10.1016/j.ceramint.2021.02.076.
- Ahmed, D.H., Naser, J., Deam, R.T. Particles impact characteristics on cutting surface during the abrasive water jet machining: Numerical study. J Mater Process Tech 232 116-130 (2016) DOI:10.1016/j.jmatprotec.2016.01.032.
- Montesano, J., Bougherara, H., Fawaz, Z. Influence of drilling and abrasive water jet induced damage on the performance of carbon fabric/epoxy plates with holes. Compos Struct 163257-163266 (2017) DOI:10.1016/j.compstruct.2016.12.007.
- Baralić, J., Savić, S.P., Koprivica, B., Đurić, S. Connection between the dynamic character of the cutting force and machined surface in abrasive waterjet machining. Stroj Vestn-J Mech E 71 36-43 (2025) DOI:10.5545/sv-jme.2024.1008.
- Pawar, P.J., Vidhate, U.S., Khalkar, M.Y. Improving the quality characteristics of abrasive water jet machining of marble material using multi-objective artificial bee colony algorithm. J Comput Des Eng 5 319-328 (2018) DOI:10.1016/j.jcde.2017.12.002.
- Junkar, M., Jurisevic, B., Fajdiga, M, Grah, M. Finite element analysis of single-particle impact in abrasive water jet machining. Int J Impact Eng 32 1095-1112 (2006) DOI:10.1016/j.ijimpeng.2004.09.006.
- Thongkaew, K., Wang, J., Yeoh, G.H. Impact characteristics and stagnation formation on a solid surface by a supersonic abrasive waterjet. Int J Extreme Manuf 1 045004 (2019) DOI:10.1088/2631-7990/ab531c.
- Anwar, S., Axinte, D.A., Becker, A.A. Finite element modelling of overlapping abrasive waterjet milled footprints. Wear 303 426-436 (2013) DOI:10.1016/j.wear.2013.03.018.
- Kevorkijan, L., Hriberšek, M., Lešnik, L., Škerlavaj, A., Biluš, I. Numerical investigation of erosion due to particles in a cavitating flow in Pelton turbine. Stroj Vestn-J Mech E 71 284-293 (2025) DOI:10.5545/sv-jme.2025.1351.
- Torrubia, P.L., Axinte, D.A., Billingham, J. Stochastic modelling of abrasive waterjet footprints using finite element analysis. Int J Mach Tool Manu 95 39-51 (2015) DOI:10.1016/j.ijmachtools.2015.05.001.
- Liu, H., Wang, J., Kelson, N., Brown, R.J. A study of abrasive waterjet characteristics by CFD simulation. J Mater Process Tech 153 488-493 (2004) DOI:10.1016/j.jmatprotec.2004.04.037.
- Long, X., Ruan, X., Liu, Q., Chen, Z., Xue, S., Wu, Z. Numerical investigation on the internal flow and the particle movement in the abrasive waterjet nozzle. Powder Technol 314 635-640 (2017) DOI:10.1016/j.powtec.2016.09.089.
- Feng, Y., Wang, J.M., Liu, F.H. Numerical simulation of single particle acceleration process by SPH coupled FEM for abrasive waterjet cutting. Int J Adv Manuf Technol 59 193-200 (2012) DOI:10.1007/s00170-011-3495-z.
- Yuan, Y., Chen, J.F., Gao, H. Surface profile evolution model for titanium alloy machined using abrasive waterjet. Int J Mech Sci 240 107911 (2023) DOI:/10.1016/j.ijmecsci.2022.107911.
- Yuan, Y., Chen, J.F., Gao, H. Erosion field characteristics of depth-control micro-hole profiles machined by abrasive waterjet based on FSI coupling. Int J Adv Manuf Technol 120 7575-7593 (2022) DOI:10.1007/s00170-022-09172-6.
- Yeoh, G.H., Cheung, C.P., Tu, J. Multiphase flow Analysis Using Population Balance Modeling: Bubbles, Drops and Particles. Butterworth-Heinemann, Oxford (2013). DOI:10.1016/C2011-0-05568-0.
- Schiller, L. A drag coefficient correlation. Zeit Ver Deutsch Ing 77 318-320 (1933).
- Morsi, S.A., Alexander, A.J. An investigation of particle trajectories in two-phase flow systems. J Fluid Mech 55 193-208 (1972) DOI:10.1017/S0022112072001806.
- Wedel, J., Štrakl, M., Hriberšek, M., Steinman, P., Ravnik, J. A novel particle-particle and particle-wall collision model for superellipsoidal particles. Comput Part Mech 11 211-234 (2024) DOI:10.1007/s40571-023-00618-6.
- Štrakl, M., Hriberšek, M., Wedel, J., Steinman, P., Ravnik, J. A model for translation and rotation resistance tensors for superellipsoidal particles in Stokes flow. J Marine Sci Eng 10 369 (2022) DOI:10.3390/jmse10030369.
- Forder, A., Thew, M., Harrison, D. A numerical investigation of solid particle erosion experienced within oilfield control valves. Wear 216 184-193 (1998) DOI:10.1016/S0043-1648(97)00217-2.
- Matsumura, T., Muramatsu, T., Fueki, S. Abrasive water jet machining of glass with stagnation effect. CIRP Ann 60 355-358 (2011) DOI:10.1016/j.cirp.2011.03.118.
- Cheng, Z., Qin, S., Fang, Z., Numerical modeling and experimental study on the material removal process using ultrasonic vibration-assisted abrasive water jet. Front Mater 9 895271 (2022) DOI:10.3389/fmats.2022.895271.
- Lv, Z., Hou, R.G., Tian, Y.B., Huang, C., Zhu, H. Investigation on flow field of ultrasonic-assisted abrasive waterjet using CFD with discrete phase model. Int J Adv Manuf Technol 96 963-972 (2018) DOI:10.1007/500170-018-1635-4.
- Haghbin, N., Spelt, J.K., Papini, M., Abrasive waterjet micro-machining of channels in metals: comparison between machining in air and submerged in water. Int J Mach Tool Manu, 88108-88117 (2015) ps://doi.org/10.1016/j.ijmachtools.2014.09.012.
- Haghbin, N., Spelt, J.K., Papini, M., Abrasive waterjet micro-machining of channels in metals: Model to predict high aspect-ratio channel profiles for submerged and unsubmerged machining. J Mater Process Tech 222 399-409 (2015) DOI:10.1016/j.jmatprotec.2015.03.026.
- Kong, L.R., Wang, Y., Lei, X., Feng, C., Wang, Z. Integral modeling of abrasive waterjet micro-machining process. Wear 482 203987 (2021) DOI:10.1016/j.wear.2021.203987.